Page Map
Background & Transition
From architectural training to software and data-driven systems
Interests & Technical Drive
Curiosity and self-directed learning that shaped my skill development and career progression
Technical Skills in Professional Contexts
How analytical thinking and programming capabilities translated into real-world impact
Role & Work Evolution
Research reports and publications
Parametric modeling and computational workflows
Data engineering and full-stack systems
Selected Full-Stack Projects
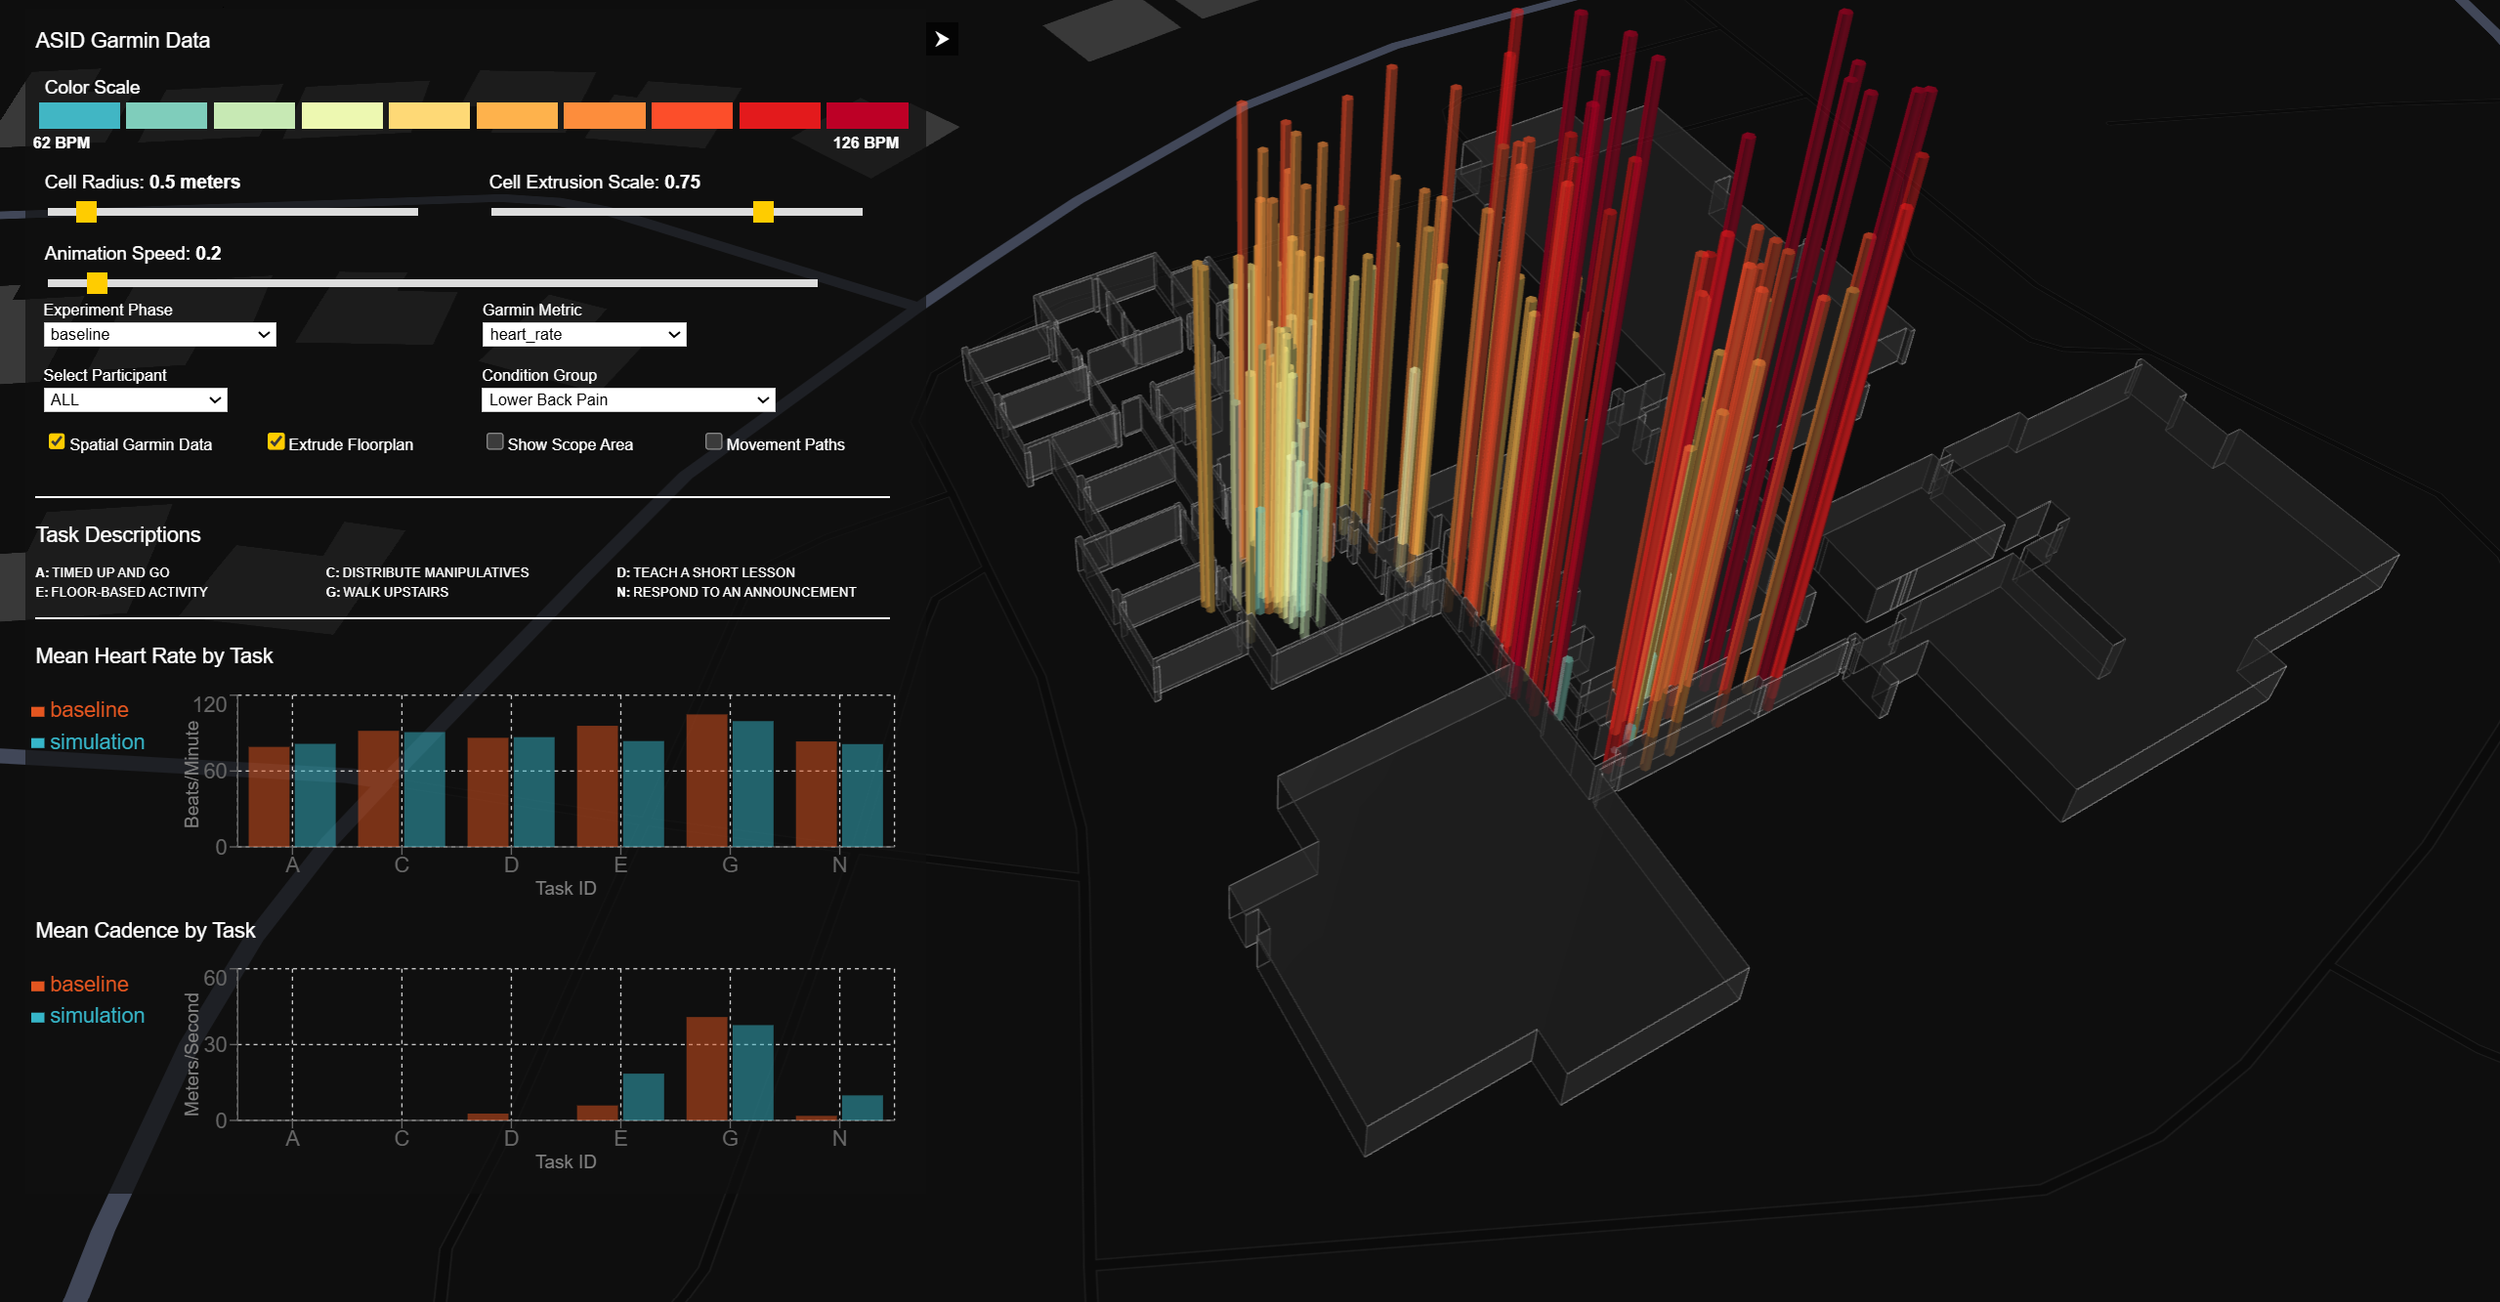
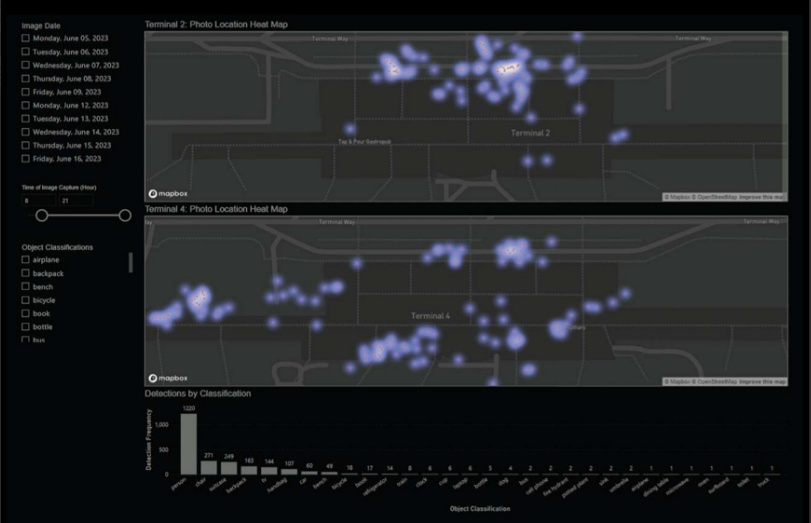
Garmin Physiological Spatial Insights
Mass Timber Carbon Calculator
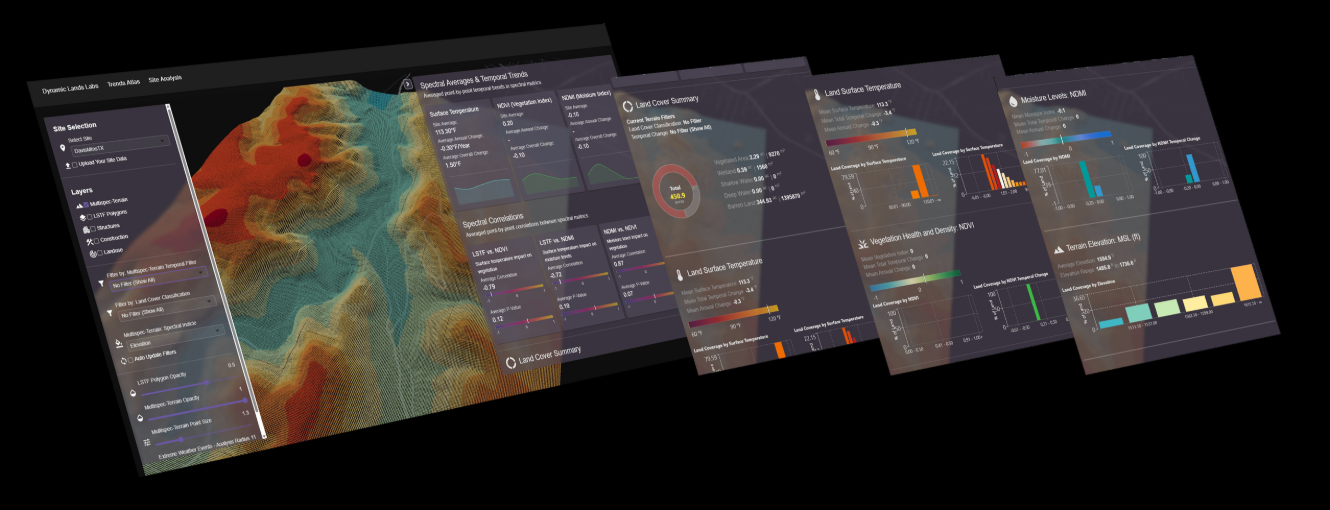
Dynamic Lands Lab
Analytical Mindset
I have long been interested in data-driven design, making decisions based on analytical, quantifiable results rather than pure intuition. In architecture school, this began as data-informed strategy and and performance-based thinking.
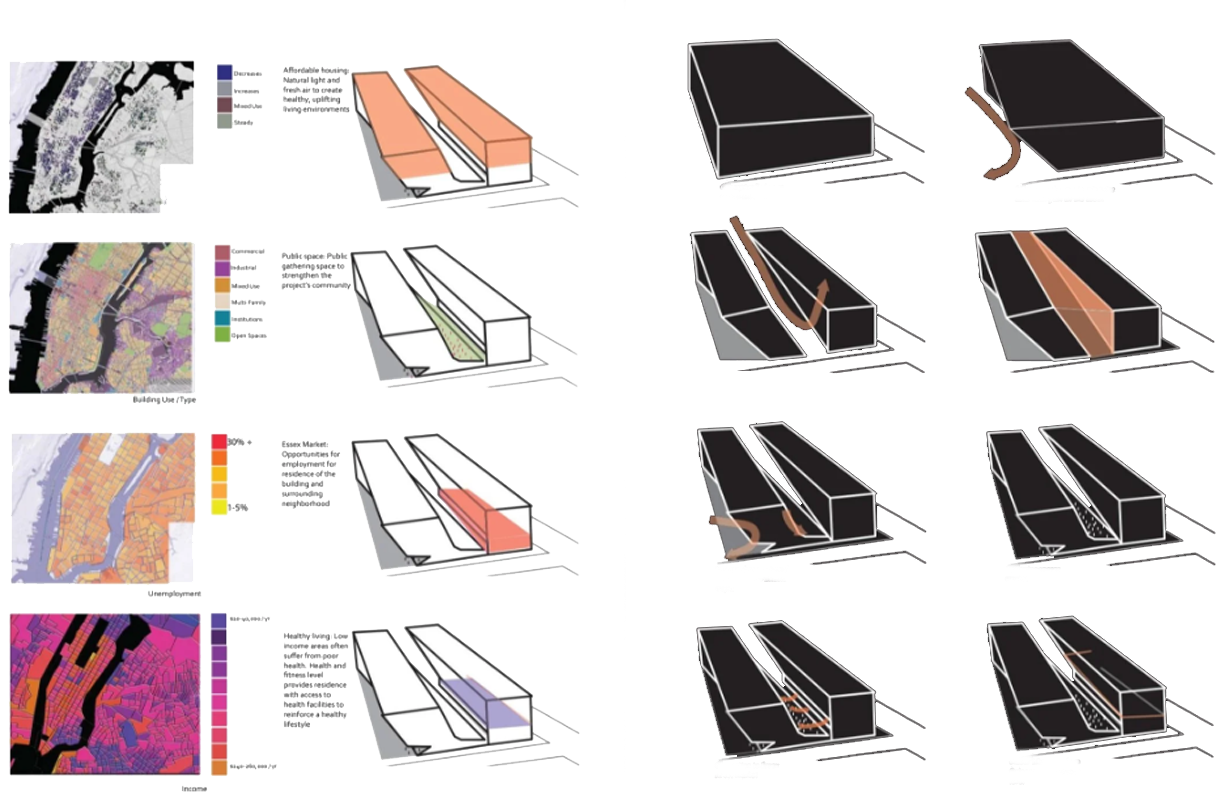
Academic portfolio excerpt: NYC demographics inform building programming
What if I could build the tools to generate the insight?
This desire to not just use insights, but build the analytical pipelines that make those insights possible is largely what lead me venture into programming.
San Francisco and Exposure to the Data Visualization Community
After graduating from KU, I tool my first professional job in San Francisco, which exposed me to a culture where software, data and visualization were primary creative disciplines.
I was particularly inspired by the data visualization work emerging from Uber’s data engineering and visualization teams, especially regarding the Kepler.GL and Deck.GL ecosystems.
The translation of invisible data into insights, grounded in physical space deeply resonated with my analytical and design oriented mindset.
I found the education and career journey of Shan He, the lead engineer of Kepler.GL to be an especially formative influence, as she also came from a formal architectural background and reoriented her career to focus on software and data.
Self-Directed Technical Growth
My development as a data scientist and software developer has been largely self-directed. While my formal roles did not initially require deep programming, data engineering or computational expertise, I’ve intentionally built those capabilities through personal research, independent projects and technical experimentation.
Grasshopper
Provided my first serious exposure to parametric logic and computational thinking. This exposure trained me to think in systems, design rule-based transformations and treat design (regarding both physical structures and visualization) as a dynamic process rather than static output.
Python
Everything seemed to accelerate when I learned Python. The application of mathematics to rule-based problem solving made calculus and statistics became intuitive, sparking my focus on data science, algorithms and data engineering projects.
I began to rely less on native Grasshopper for computational flows and focused more on Python-based computation, using Grasshopper as a data visualization tool.
Python unlocked mathematical modeling, algorithms, analysis and transformation, computer vision, geospatial processing and automation pipelines.
JavaScript
Wanting to bring data visualization to interactive, browser-based environments, I began working with D3.JS, Three.JS and later, Deck.GL.
This allowed me to share interactive visualizations outside of the Rhino/Grasshopper environment.
TypeScript
As projects grew more complex, such as the frontend for DynamicLandsLab, I introduced TypeScript for stronger typing and maintainability.
This is where my focus began to shift from exploratory projects to an increasing focus on wanting to build tools that could be used by others, beyond visualization.
React
At the same time I learned TypeScript, I began building with React to create dynamic, interactive tool experiences. React’s emphasis on reusable UI components reinforced ecosystems-level thinking in other areas of programming, including building flexible, function and class-based tools for Python.
React expanded how I though about coding practices and UI/UX, as I could now allow users to select parameters, filter data, trigger workflows and visualize results in real time.
C#
C# emerged through deeper work within the Rhino + Grasshopper ecosystem to build terrain modeling and analysis plugins for Dynamic Lands Lab. While a more recent addition to my language skillset, as I translate Python tools to C# for compileability, speed and scalability, C# has proven be a computationally powerful tool.
2019
2020
2021
2022
2023
2024
2025
2026
Personal Projects & Areas of Investigation
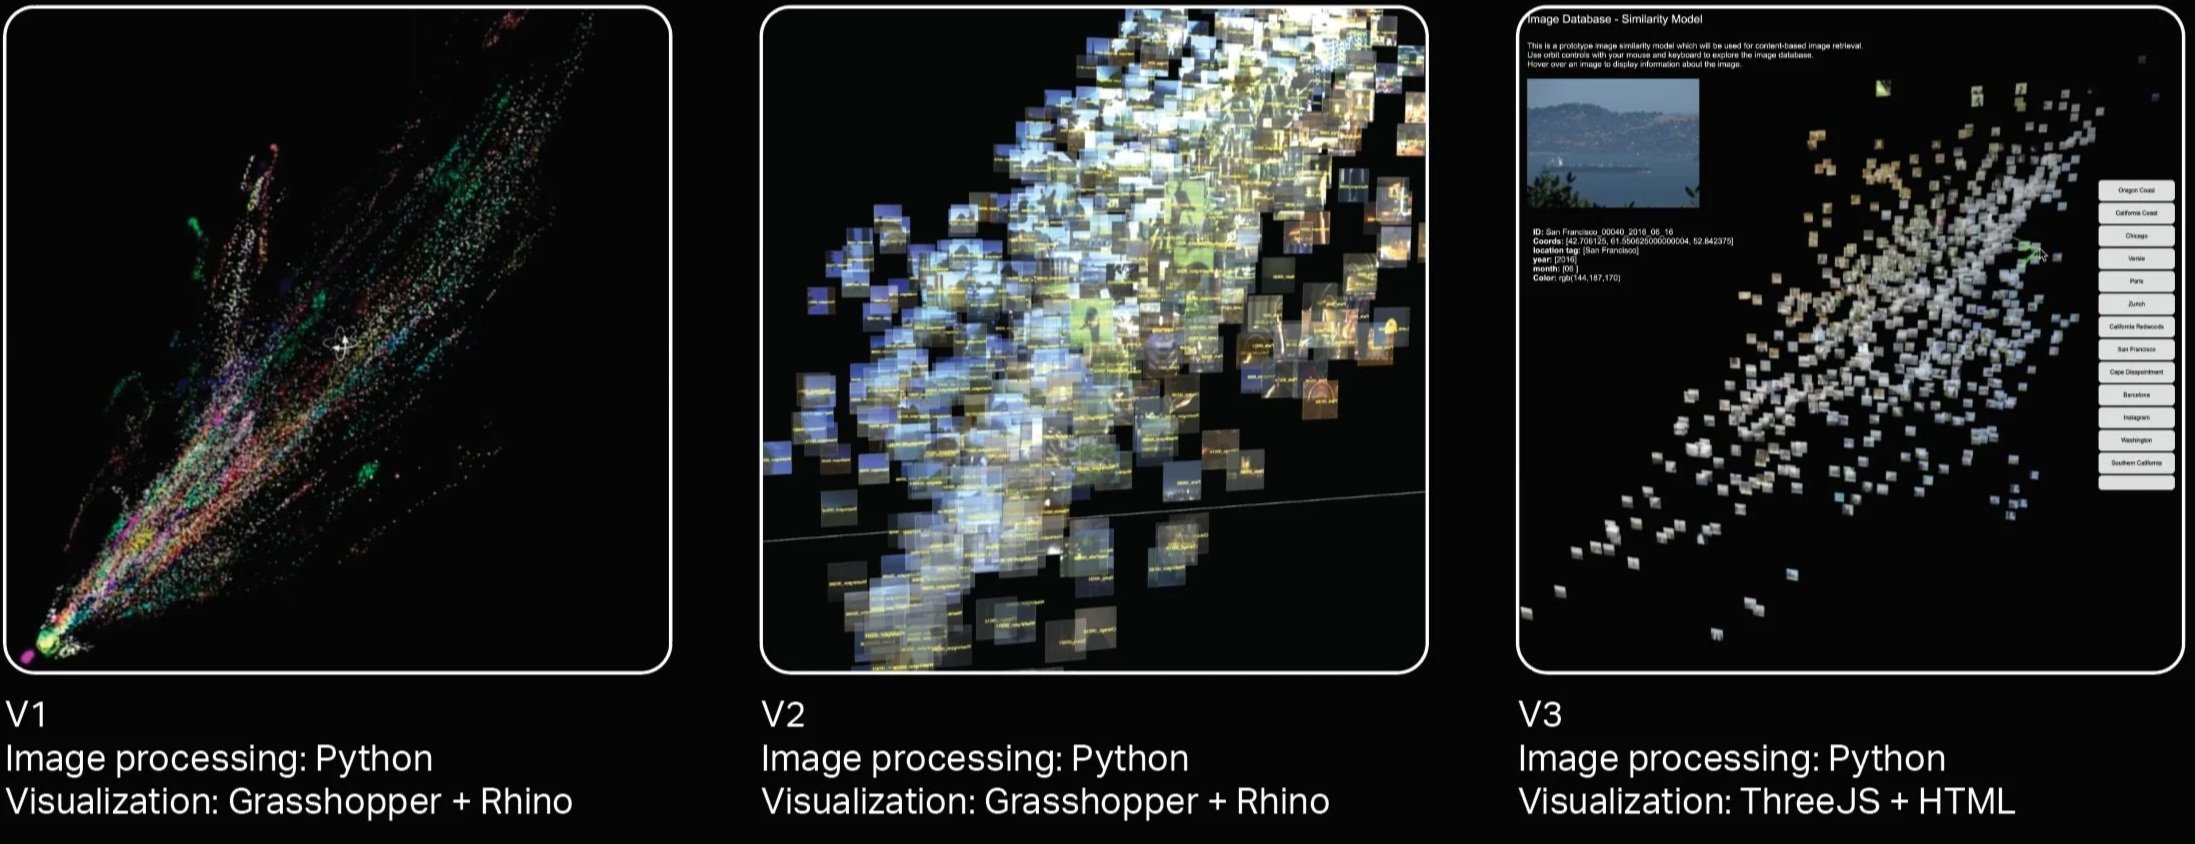
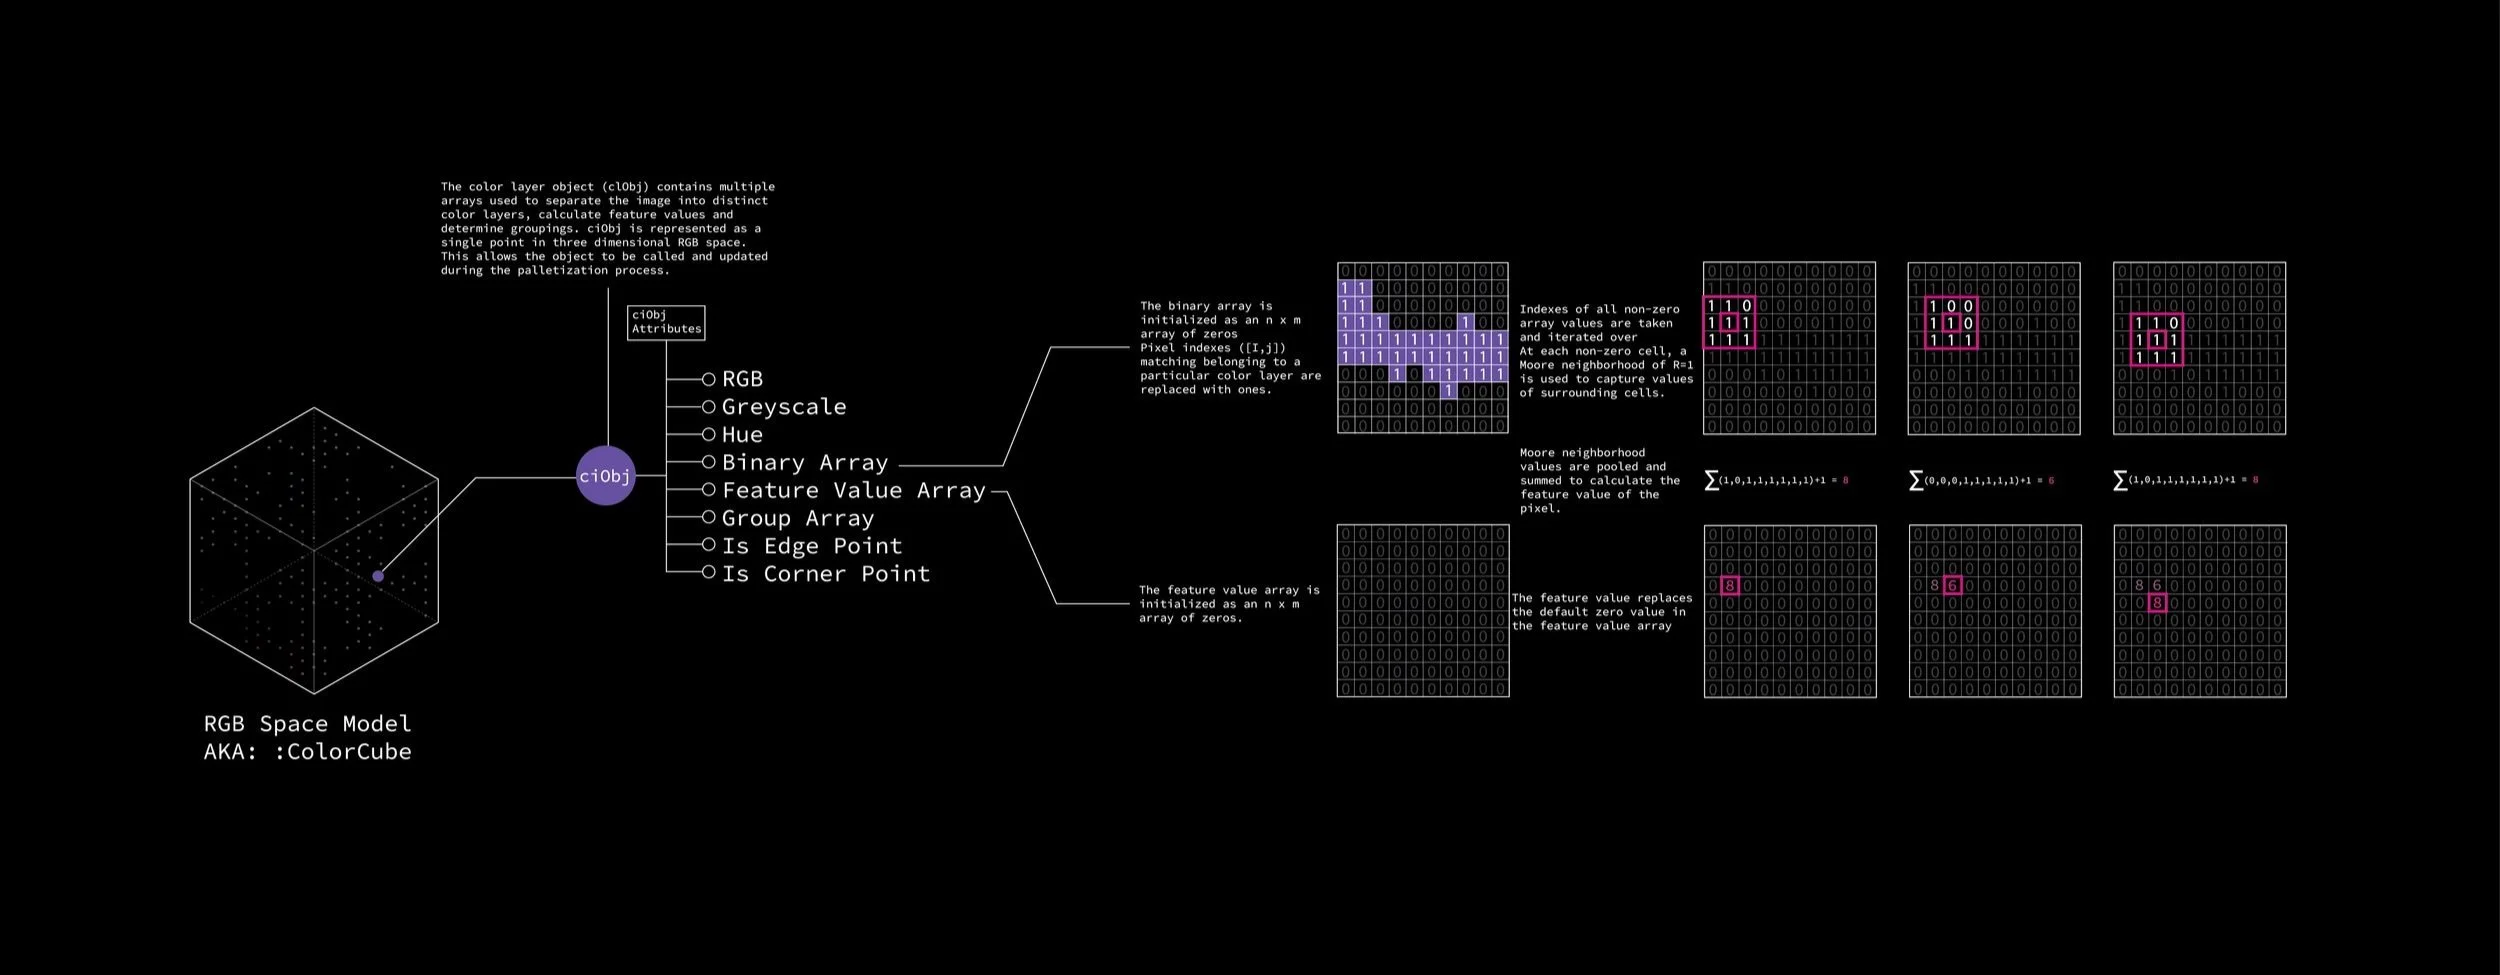
Image processing: moment signatures, similarity clustering and cellular automation
Moment signatures and similarity clustering (with ThreeJS visualization)
Class and object-oriented programming
Application of cellular automation in color image and geospatial raster data segmentation
Geospatial data and WebGL rendering
Interactive interface and visualization for web applications


Data processing & primary computational logic
Visualization (diagram post production in Adobe Illustrator)
Data processing & primary computational logic
Model-space reconstruction logic and visualization

Data processing & primary computational logic
Prototype visualizations
Three.JS interactive visualization + UI
Data processing & primary computational logic
WebGL geospatial rendering with DeckGL in React
Performance optimized terrain modeling components for Rhino/GH
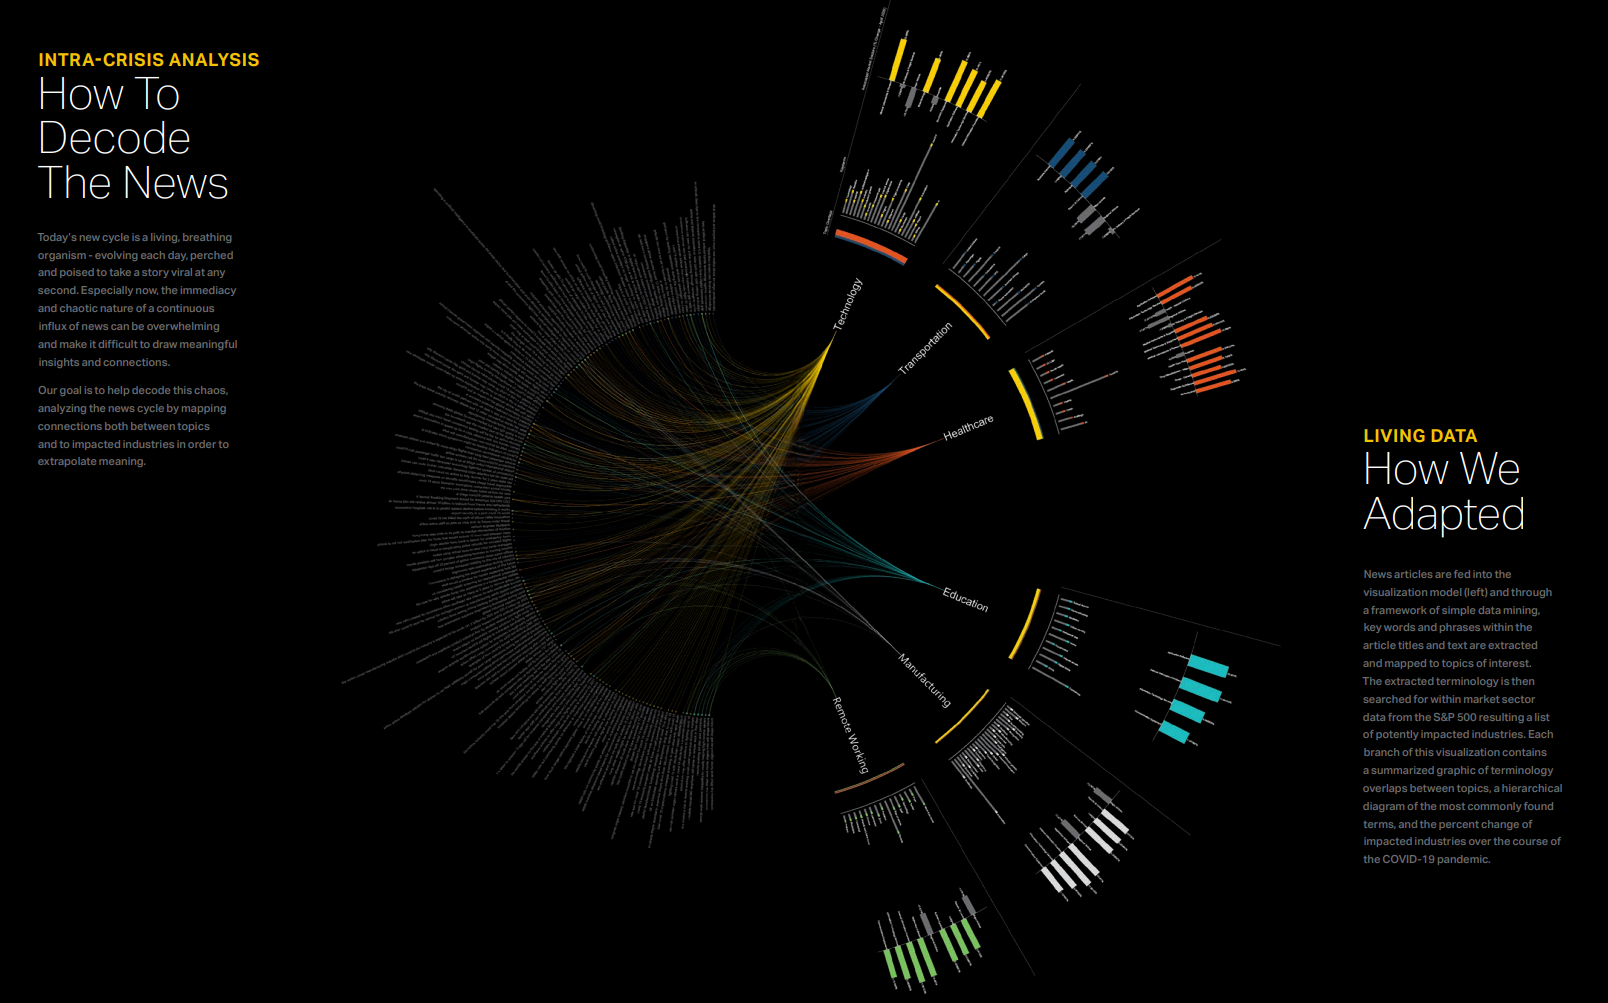
Commercial Aviation Fleet Mix and Industry Pattern Analysis
In Parallel with the operational modeling at SFO, I independently developed a comprehensive analysis and visualization tool to study spatial and temporal patterns in commercial aviation. The focus was on understanding how fleet mixes had changed over time and how these shifts impacted airport infrastructure. Using O/D data and aircraft type records, I highlighted how emerging aircraft/fleet trends could impact airport design requirements.
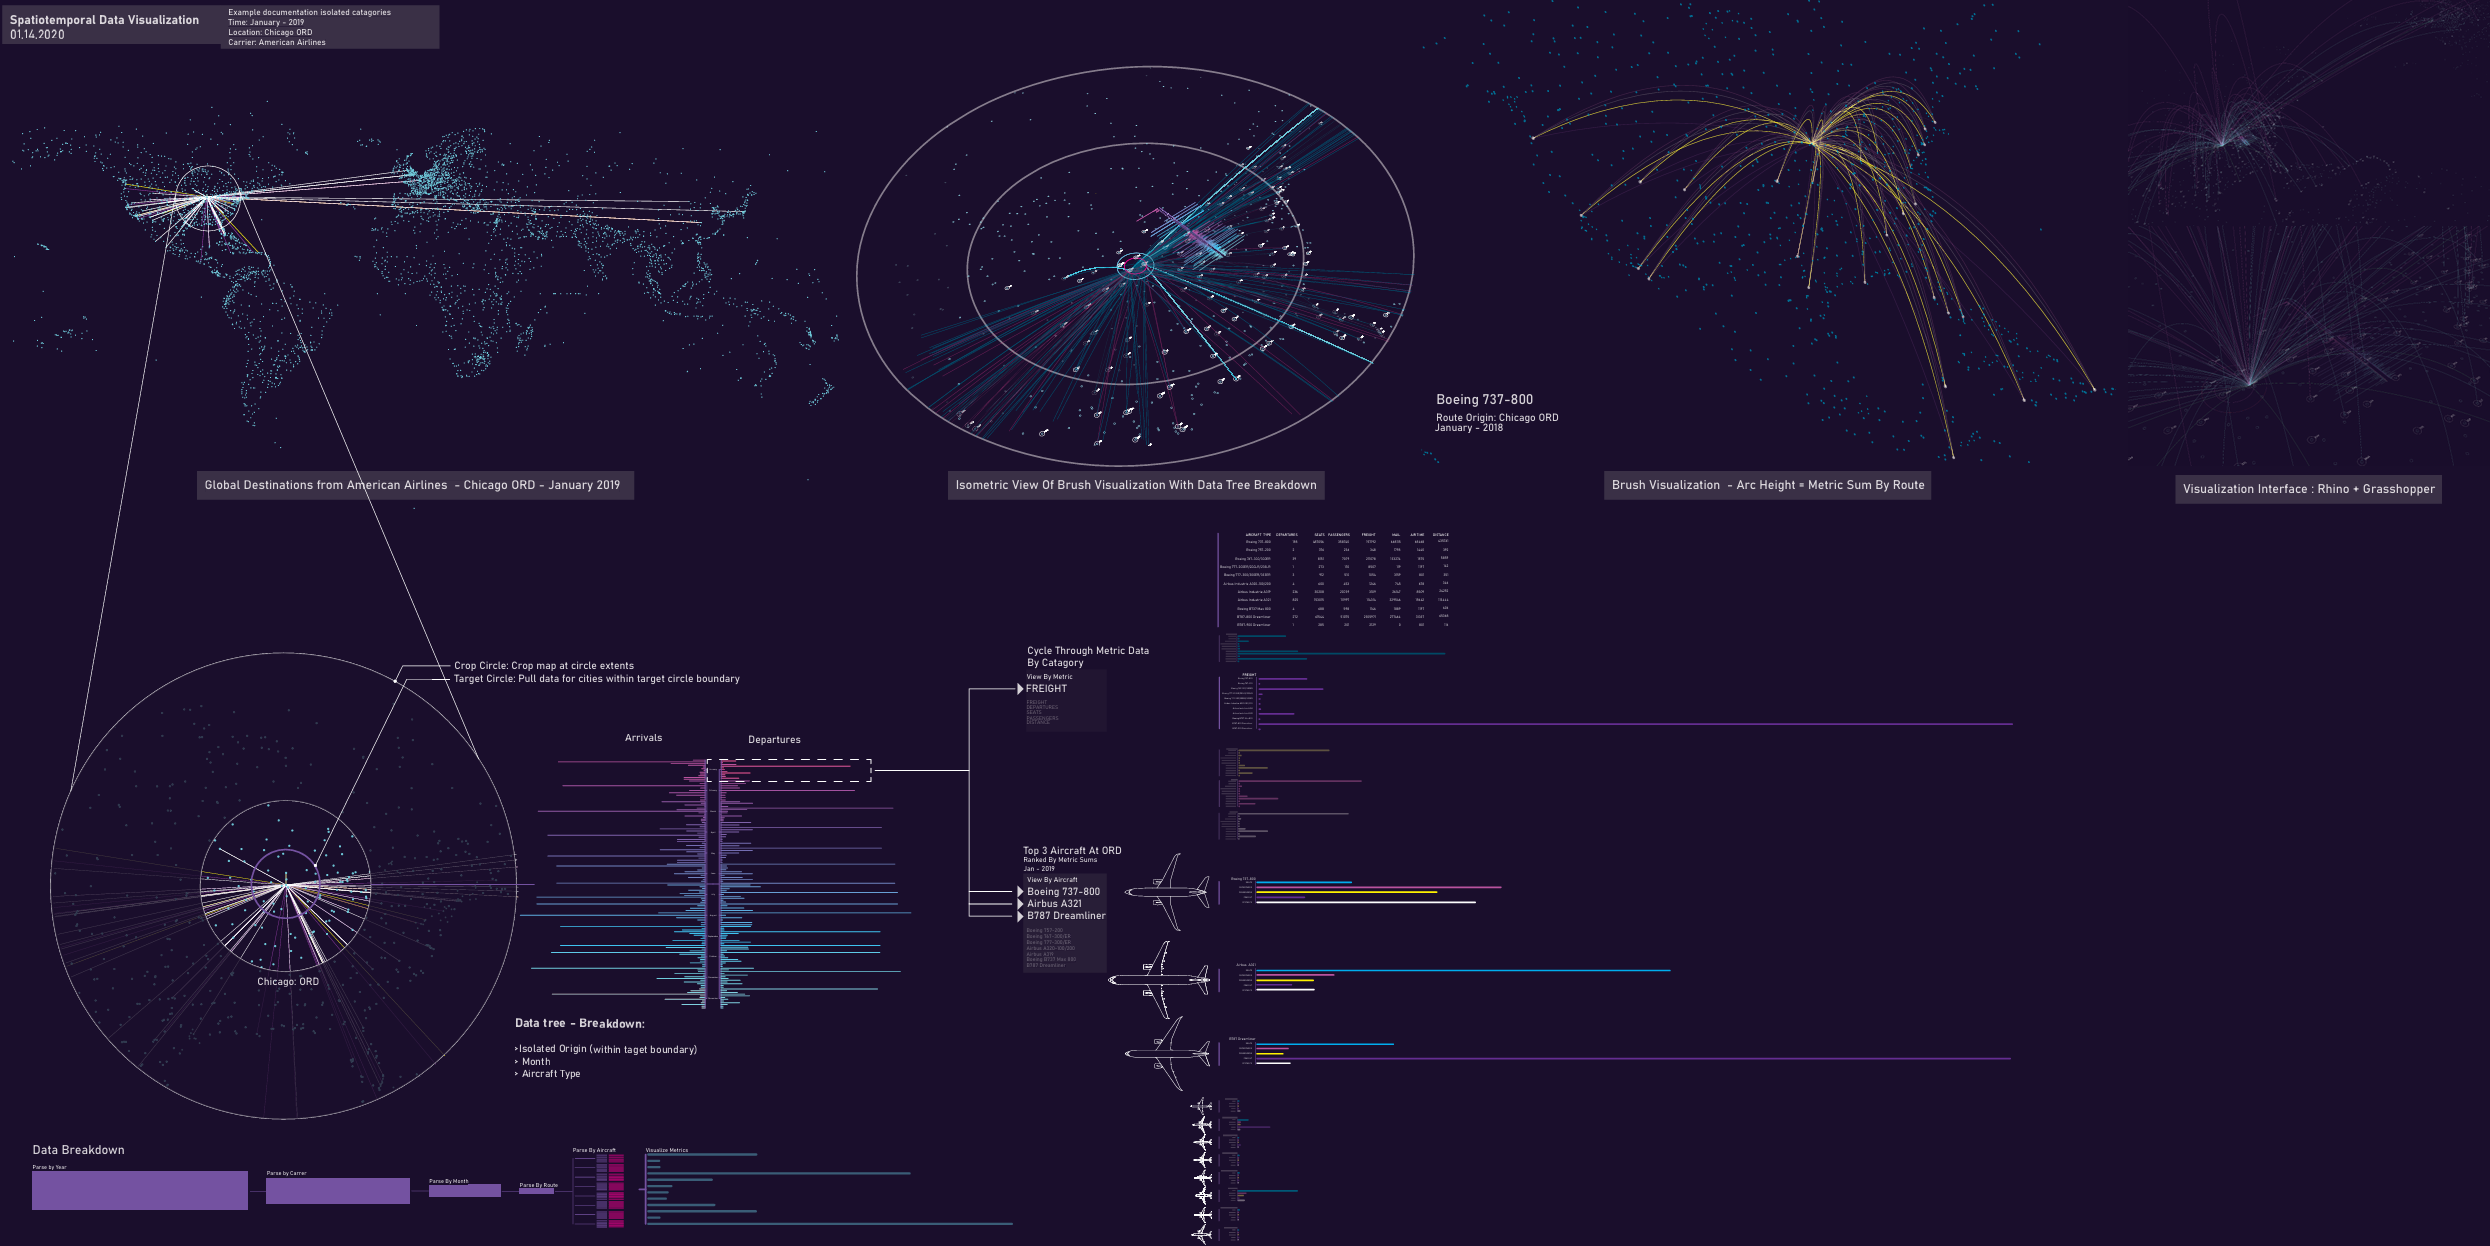
See this project published in The 2020 Curiosity Report
Continued Application
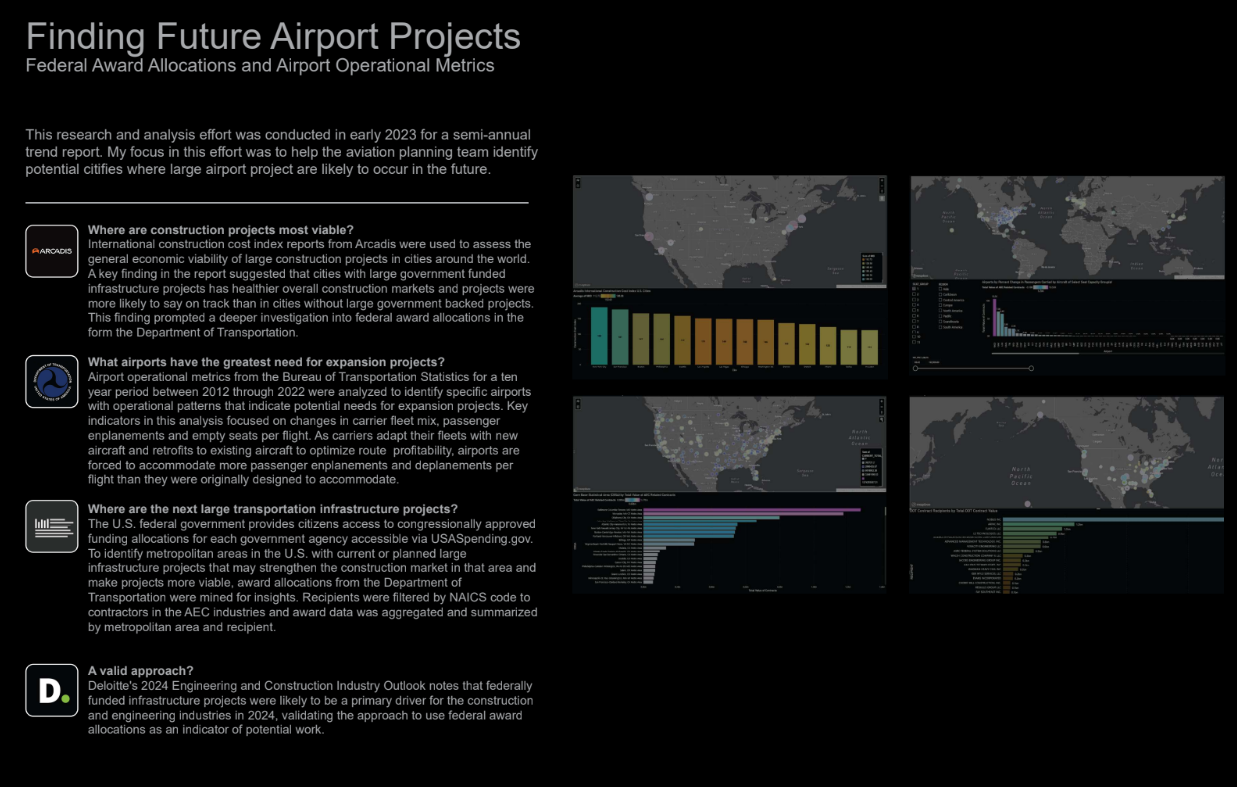
The aviation industry analysis initiative catalyzed a broader effort within the firm to conduct large-scale data-driven market intelligence that continues today.
Professional Applications
A predictive aviation analytics tool that modeled flight delays and gate assignments from historical data, visualizing spatiotemporal risk in a 3D Rhino environment to proactively avoid on-site conflicts with deplaning passengers.
Expanding analytical, computational and visualization capabilities
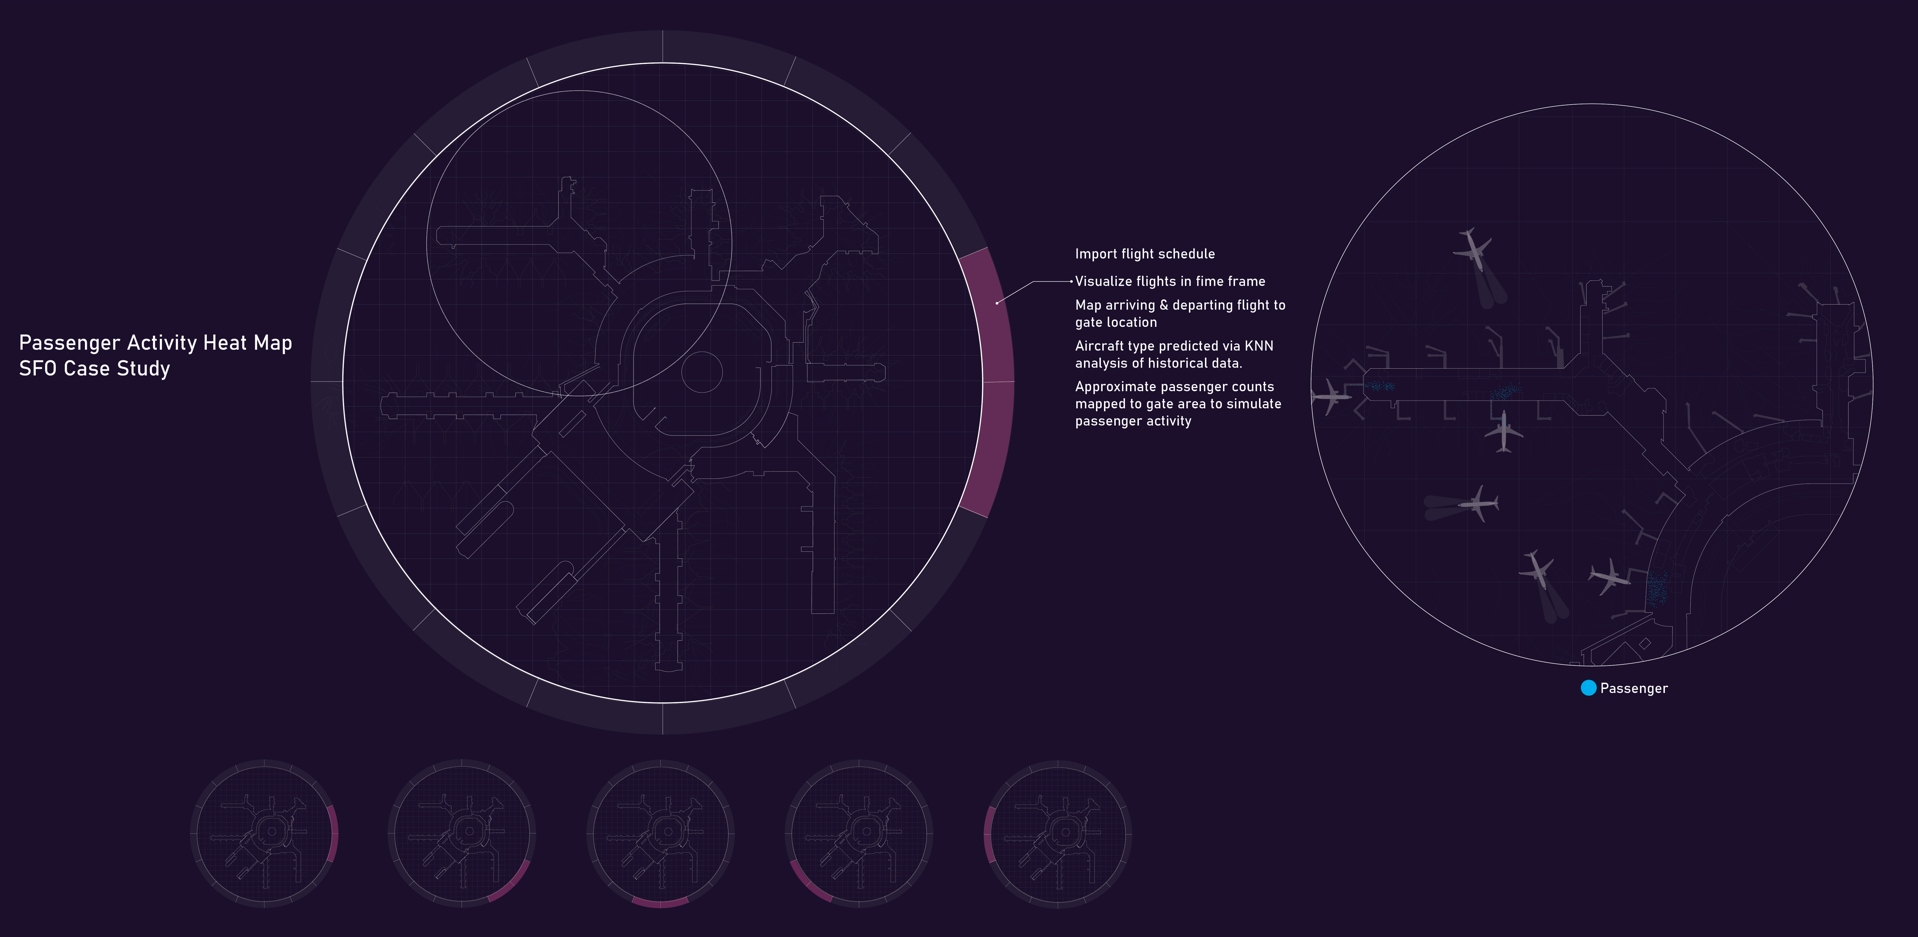
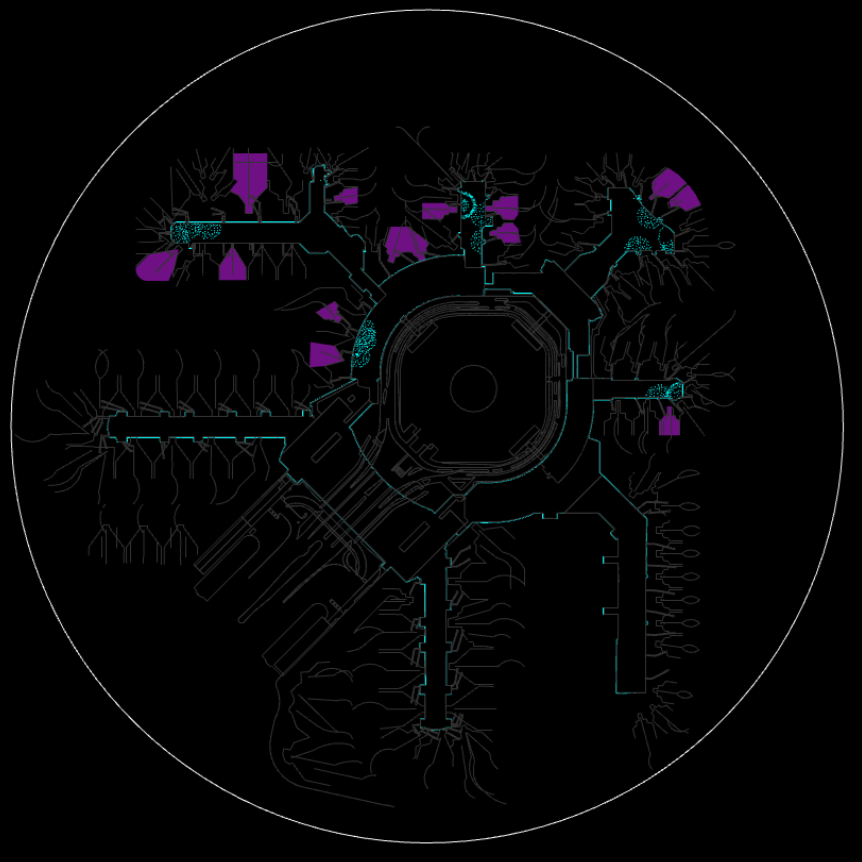
Predictive Operations Modeling
While embedded at Corgan’s SFO project office, I developed a predictive analysis tool to support overnight wayfinding deployment. Gate signage had to be revealed across the airport in one night prior to flight operations resuming in the morning. There was a risk of unexpected late arrival flights disrupting work zones.
On my own time, I built a system that analyzed historical BTS flight data to model late arrival probability and estimate passenger volume based on aircraft type. Using Grasshopper and Rhino, I mapped this data at 30 minute increments across the airport to visualize when and where late arrivals may occur.
Evolving Role
My role has evolved through self-directed technical and strategic development
Analytics, reports & publications
Data science & visualization
Computational workflows & automation
Market forecasting analytics pipelines
Data engineering
Geospatial analysis and remote sensing
Frontend web development
Full-Stack
2026: I design and build data-driven systems that transform complex data into analytical tools and interactive applications that expand our team’s capabilities and inform real-world decision-making.
2020
2021
2022
2023
2024
2025
2026
Analytics, reports & publications
A sustained contribution to research reports and publications that translate complex analysis into clear, credible insights. My work focuses on grounding claims in rigorous data analysis and presenting results through intuitive visualizations that make patterns immediately legible. Over time, this work has also helped shape the team’s visual language and analytical style across research outputs.
Data science & visualization
A continuous growth trajectory of expanding my analytical capabilities. From descriptive, statistical analytics, to machine learning, neural networks and AI tools. I maintain a strong emphasis on gaining a deep understanding of the mathematics, data structures and algorithms behind analytical systems.
Computational workflows & automation
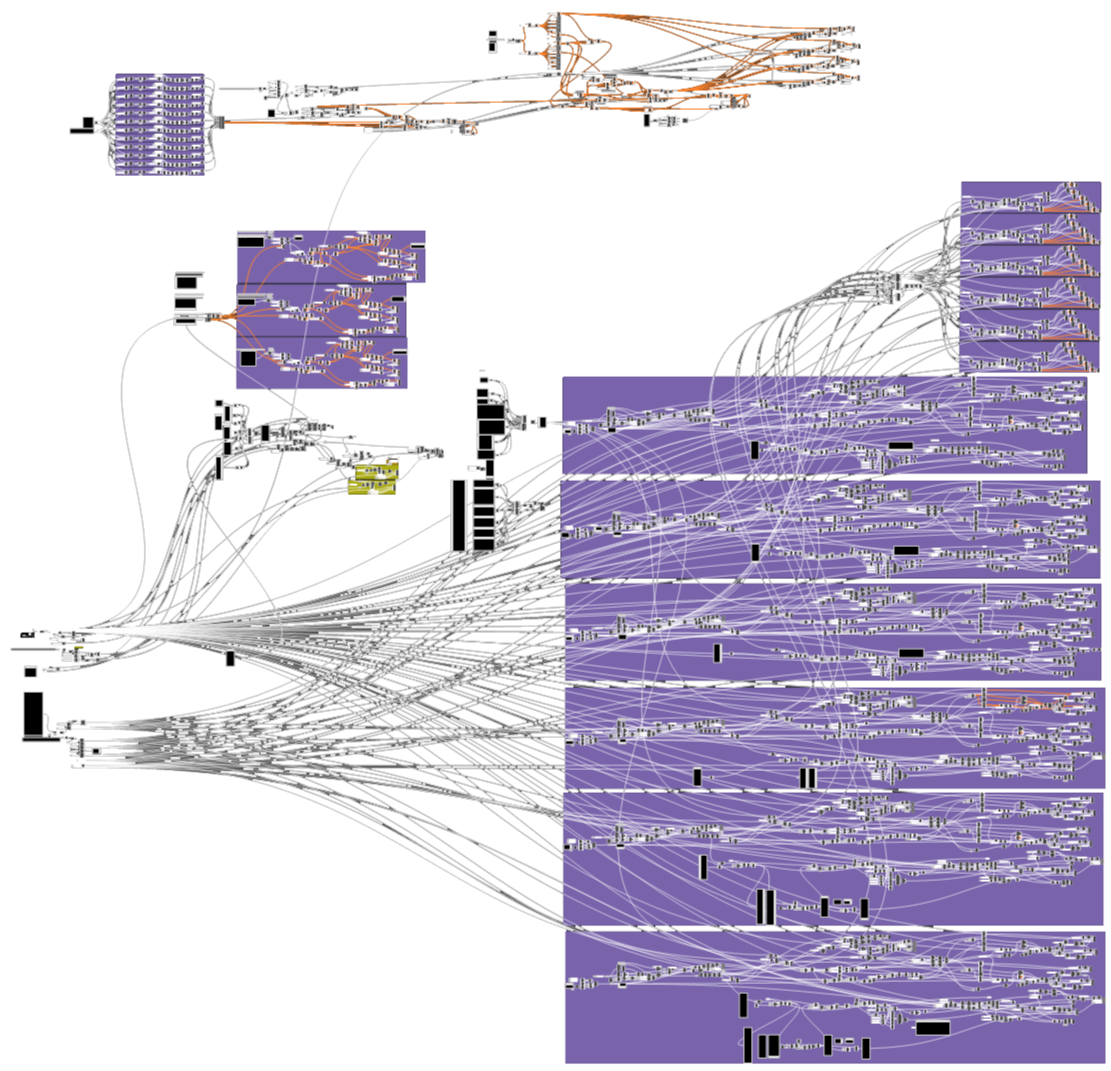
Greater focus on streamlining processes for repeatability and usability. Began with simple single script Python automation tools and now involves codebase/ecosystem-level thinking.
Market forecasting analytics pipelines
I began being tasked by executive leadership to build analytical systems to aid in business development and strategic growth decisions. These quickly grew into large-scale, multi-temporal, geographic market analysis and forecasting tools, involving streamlined data engineering pipelines for data ingestion, harmonization, cleaning and analysis, as well as front-end interfaces to make insights actionable for non-technical stakeholders.
Data and systems engineering
As analytical scope grew, I needed develop repeatable processes to move quickly and efficiently. This strengthened and expanded the ecosystem-level thinking I developed through building computational workflows with a greater emphasis on data engineering pipelines.
Geospatial analysis and remote sensing
I began working with geospatial raster data from remote sensing sources including Landsat to support environmental and sustainability research efforts. Seeing the value in integrating geospatial analytics in design workflows, I have since been a strong advocate for building geospatial/GIS services at Corgan and have built technical infrastructure to make that possible.
Frontend web development
Took on front-end development projects such as the Mass Timber Carbon Calculator and began applying a greater focus on building front-end web-based interfaces to support analytical projects.
Full-Stack
Embraced a strong emphasis on building end-to-end systems and ecosystem-level thinking from data engineering, analytics and automation to UI/UX.
2020
2021
2022
2023
2024
2025
2026
Visualization and Analytics with Parametric Scripting
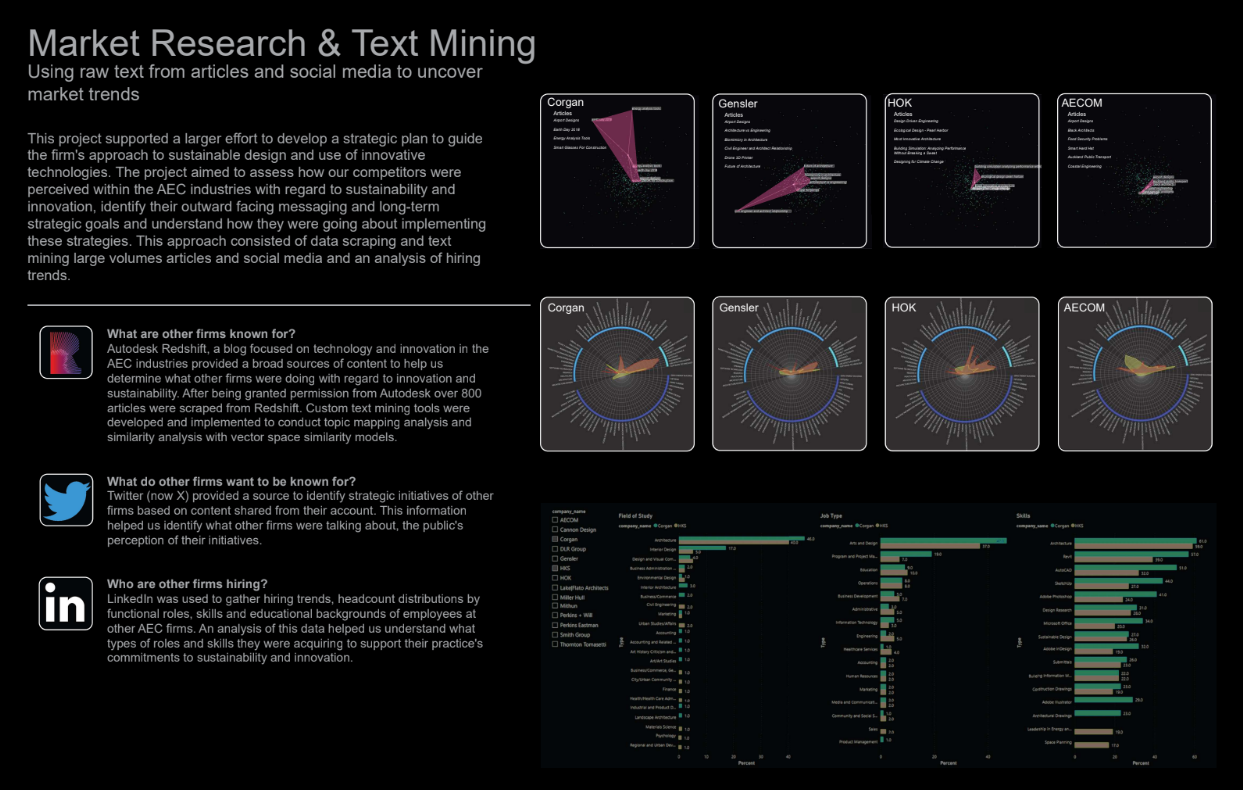
Market research and analytics with web scraping, text mining and NLP
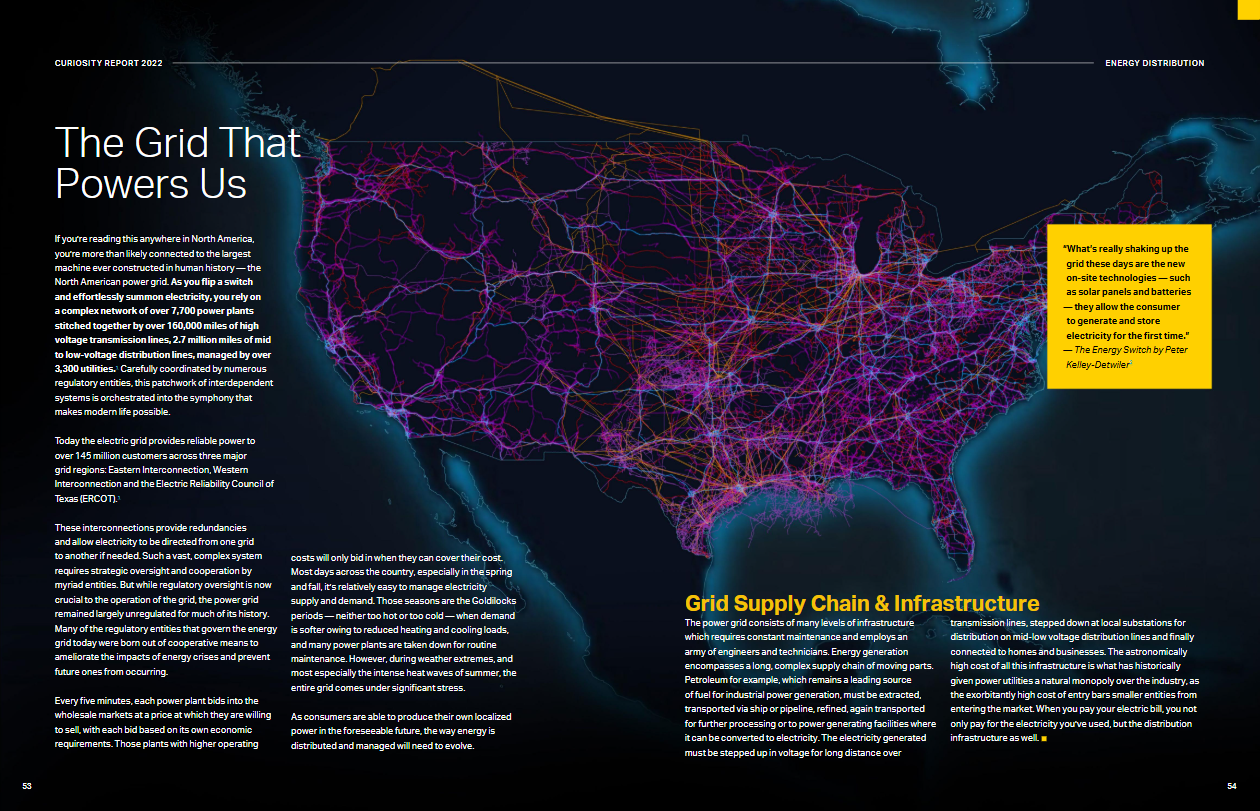
Energy infrastructure mapping and analysis
Commodity flow analysis and the impact on infrastructure

Spatial analysis tools and visualizations
Interactive housing market and demographics analysis
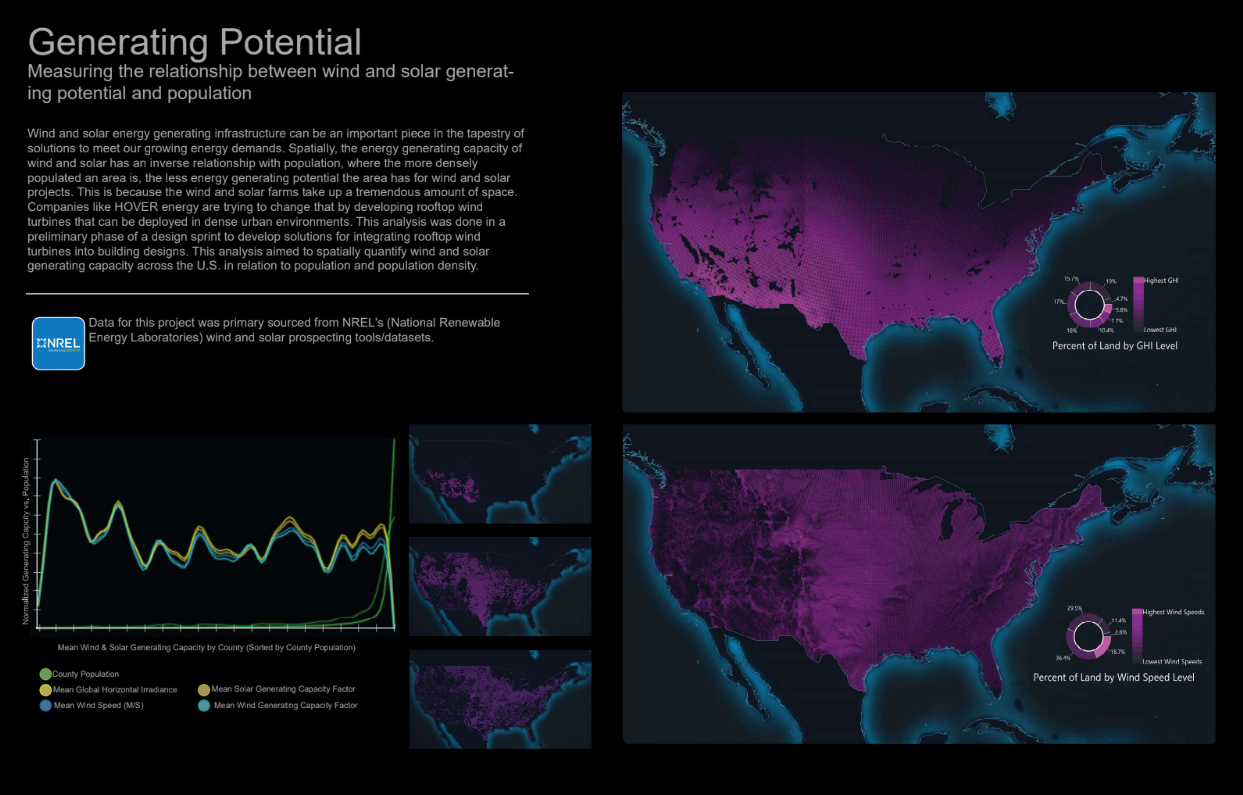
Energy generating potential by location
Data-Driven Parametric Design Workflows
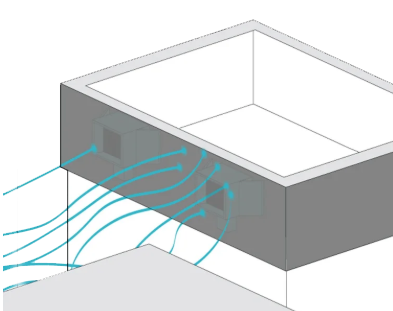
Client: Hover Energy
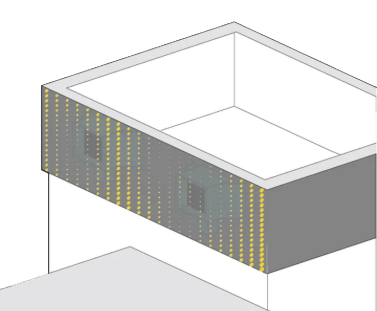
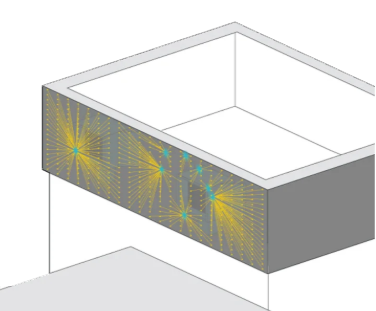
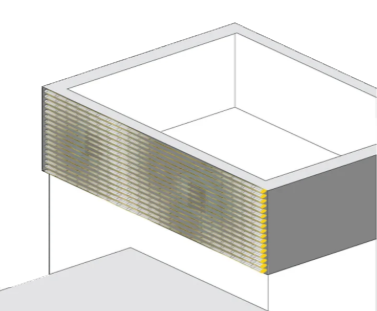
Scope: Develop computational approach for wind-screen designs that maximize airflow with minimal turbulence to drive rooftop wind turbine units.
Dynamic CFD responsive screening systems
Logic to maximize airflow to turbines and minimize flow turbulence
Client: EdenGreen (Vertical Farms)
Scope: Develop a streamlined approach for right-sizing vertical farm systems to meet production requirements and spatial constraints. Spatial configuration options for micro-farm integration in commercial structures.
Parametric right-sizing and layouts
Model air flow
Optimize louver profile for max airflow and minimal turbulence
Cluster facade control points with nearest airflow x brep intersections
Loft and join louver profiles
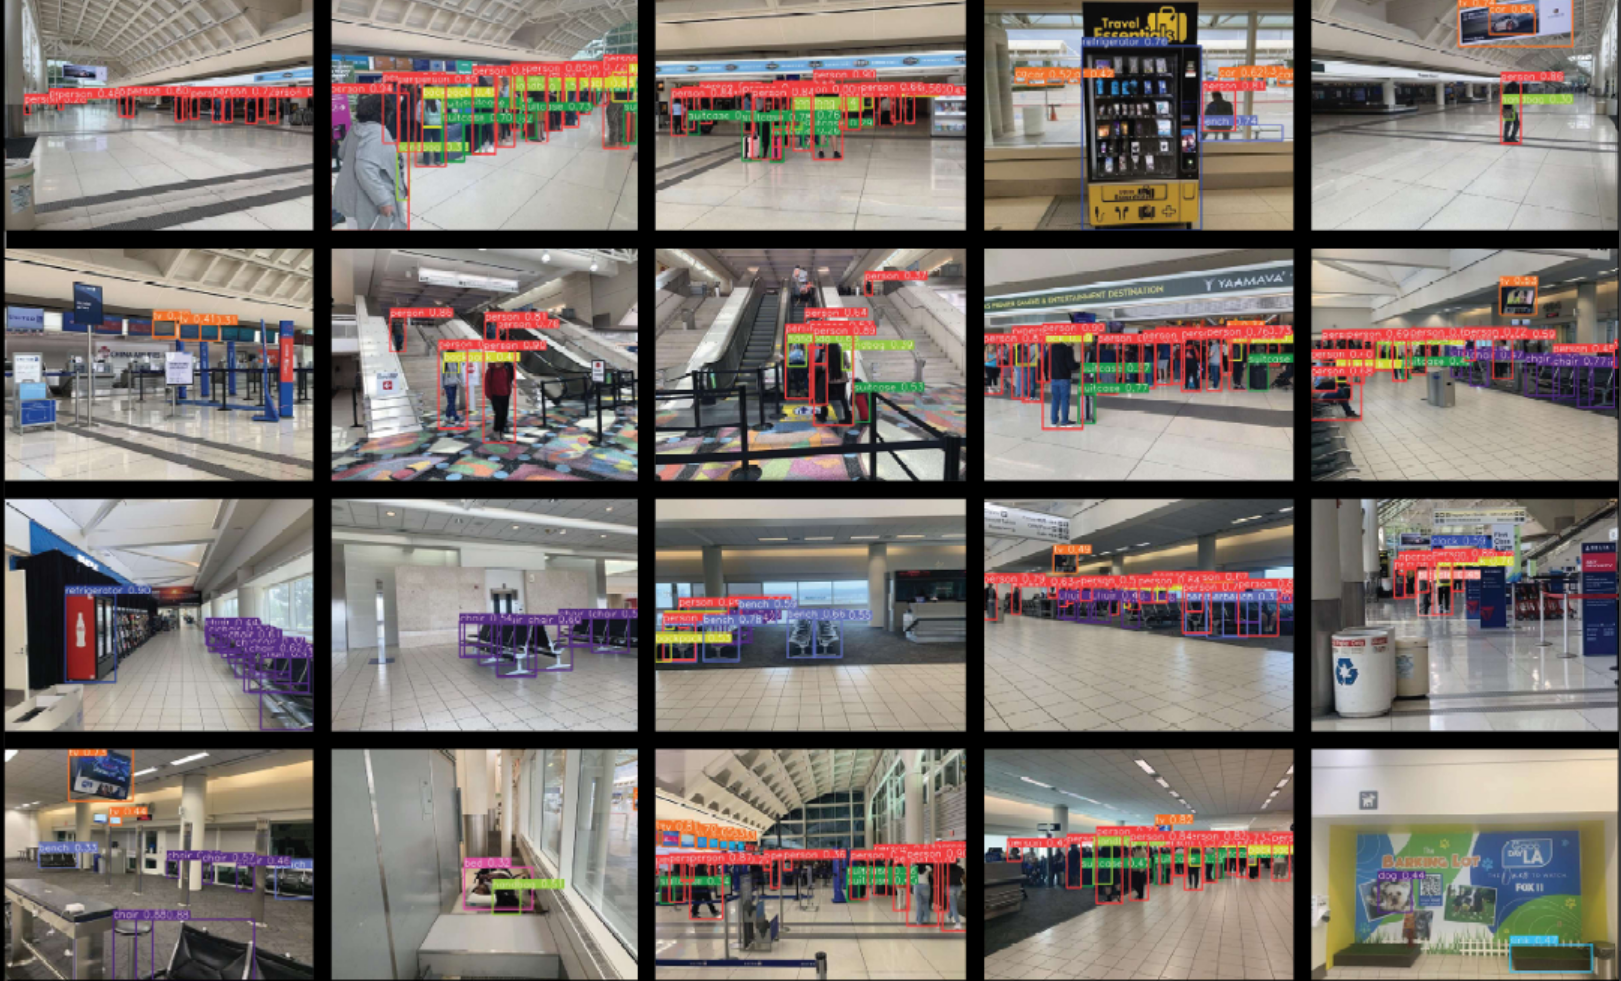
Passenger Experience Modeling With Computer Vision and IMU
Client: Ontario International Airport (ONT)
Scope: Identify design-related pain-points and improvement opportunities in passenger experience. Study participants wore eye tracking glasses to track eye movement while simulating a typical passenger journey.
This streamlined data processing and analysis pipeline ingests eye tracking metrics, recorded video and IMU data to identify when participants displayed signals of confusion and focus.
Mapping what was seen, when and where with streamlined YOLO detection and classification + exif extraction pipelines.
Combined signal analysis and spatial insights
Full-Stack Applications