Garmin Data Explorer
Developed For: Corgan's R&D team and Education studio to support a comprehensive research study into the physiological impacts of chronic health conditions and the impact of learning environments on teachers.
Notable Features
Python ETL pipeline for multi-sensor time-series synchronization
CRS harmonization with Pyproj
Timestamp-based path reconstruction with recursive interpolation for path smoothing
WebGL geospatial rendering with DeckGL
React state-driven UI for interactive filtering and analysis
Overview
A full-stack analytical application designed to correlate physiological signals with spatial environments. The system ingests raw Garmin activity exports and processes heart rate, walking pace, cadence, and GPS data through a Python-based transformation pipeline. Multi-sensor time-series streams are synchronized and normalized into a composite geospatial dataset, binding physiological signals directly to spatial coordinates.
To ensure spatial integrity, GPS data was harmonized to the WGS84 coordinate reference system. Location points were spatially resampled to mitigate signal noise and drift, then reconstructed into continuous walking paths by sequencing timestamps and recursively interpolating intermediate positions. This enabled smooth, motion-based visualizations of biometric response along movement trajectories.
The frontend application built with React, Vite, Deck.gl, and Recharts allows users to interactively explore these spatial-physiological relationships. Stakeholders can visualize biometric fluctuations along paths, filter metrics dynamically, and assess how environmental layout conditions may influence human response. The application is deployed via Vercel for internal use and demonstrations.
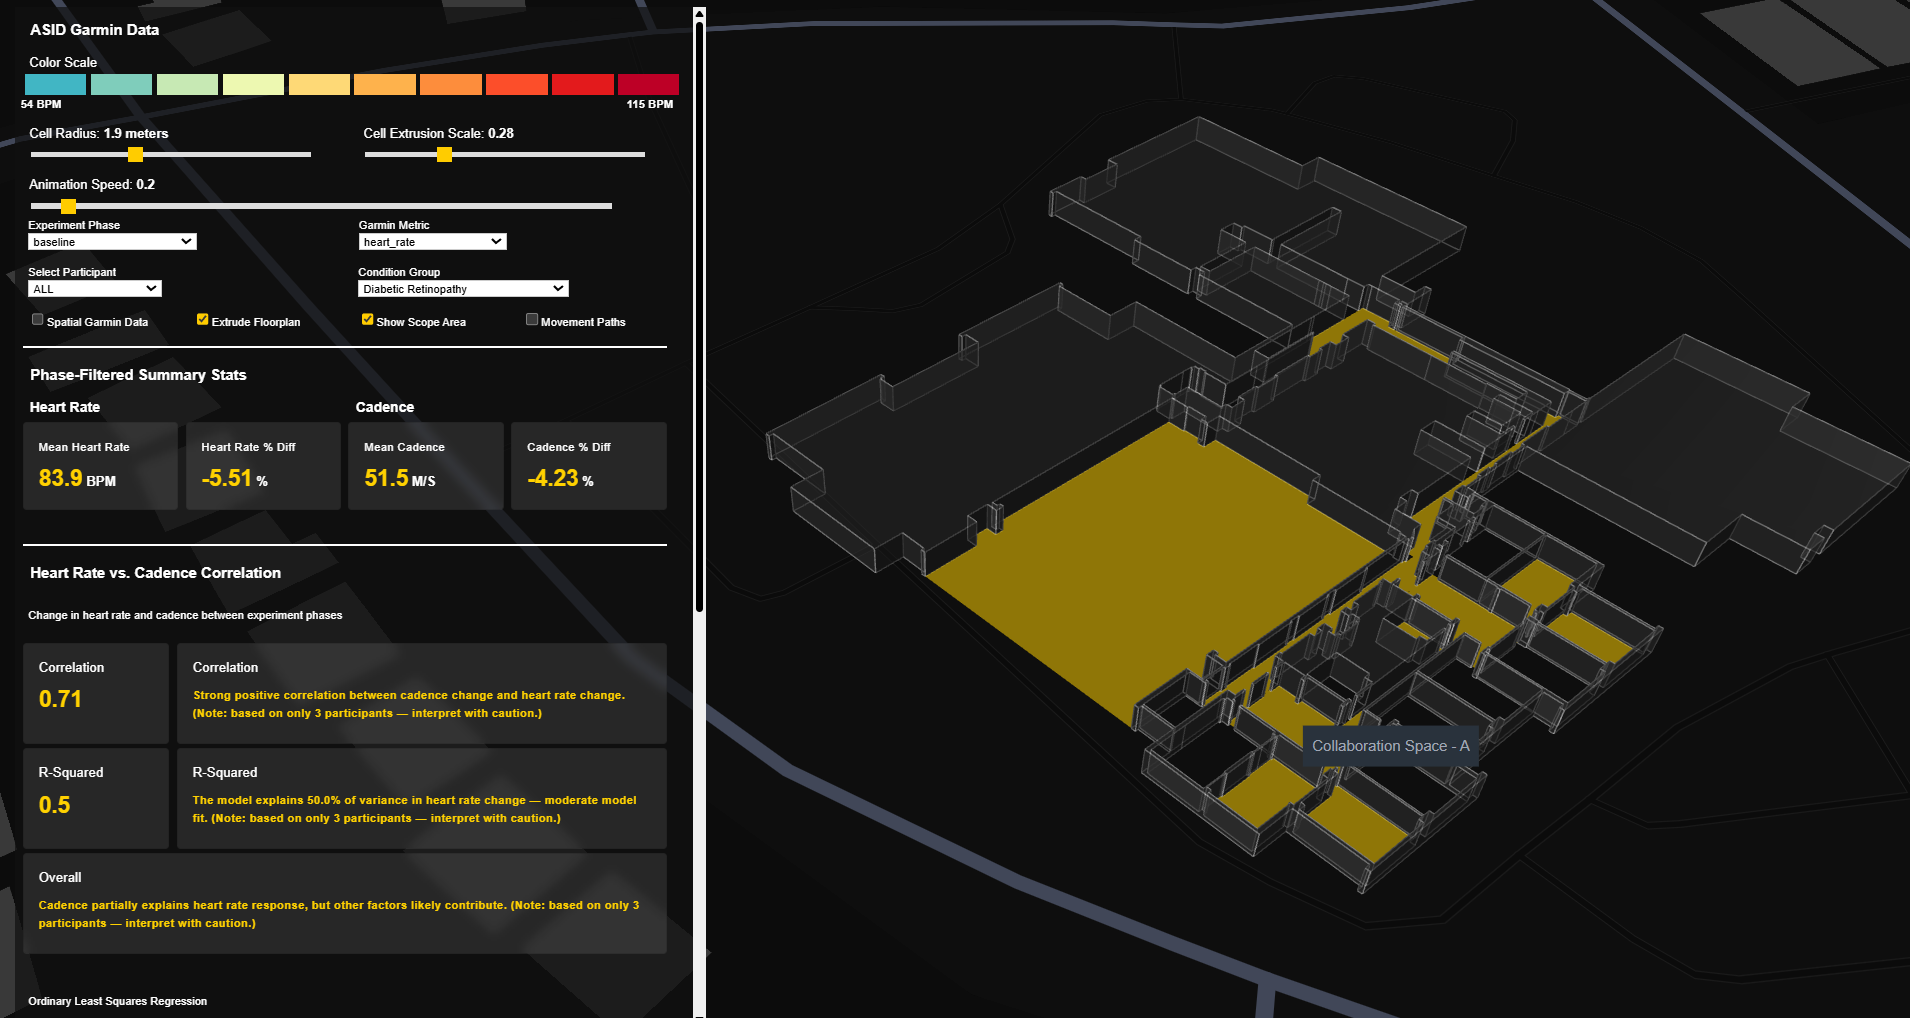
Geojson layer extrusion toggles allow the user to render the model in 2D and 3D
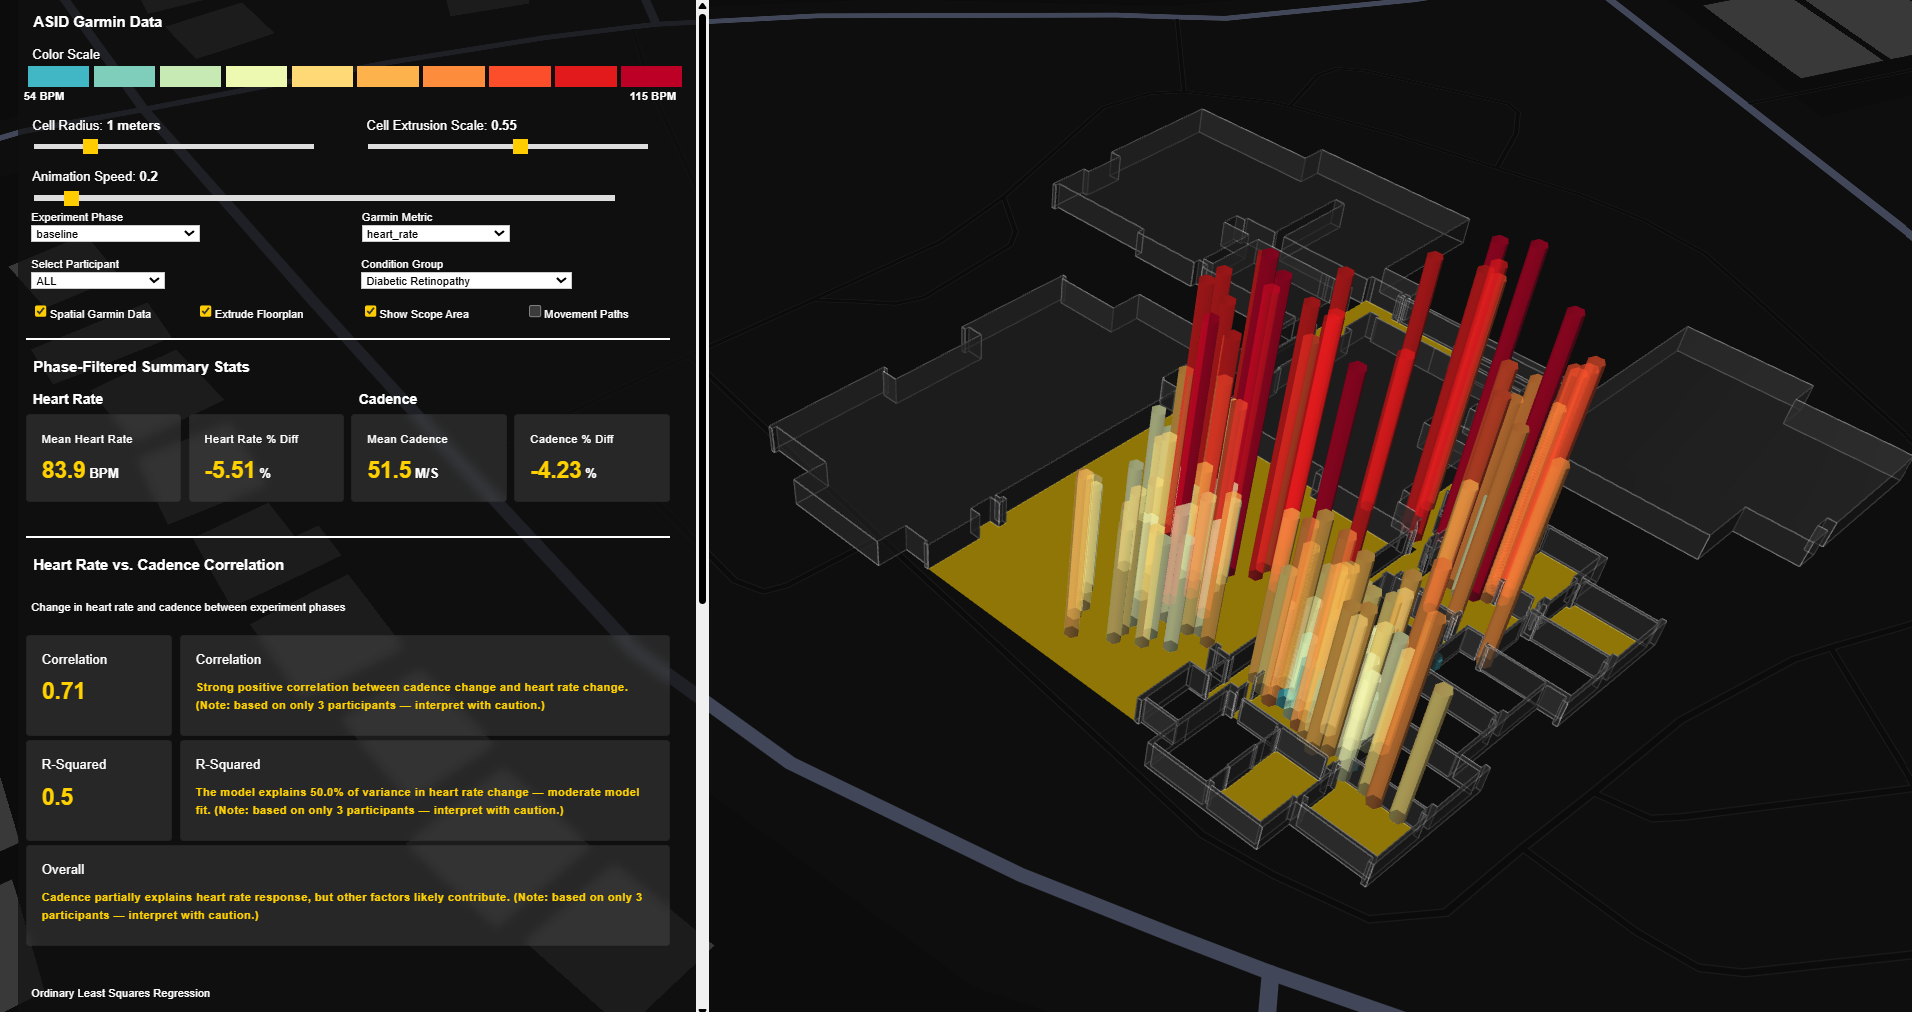
Sliders also control the hexbin extrusion scale.
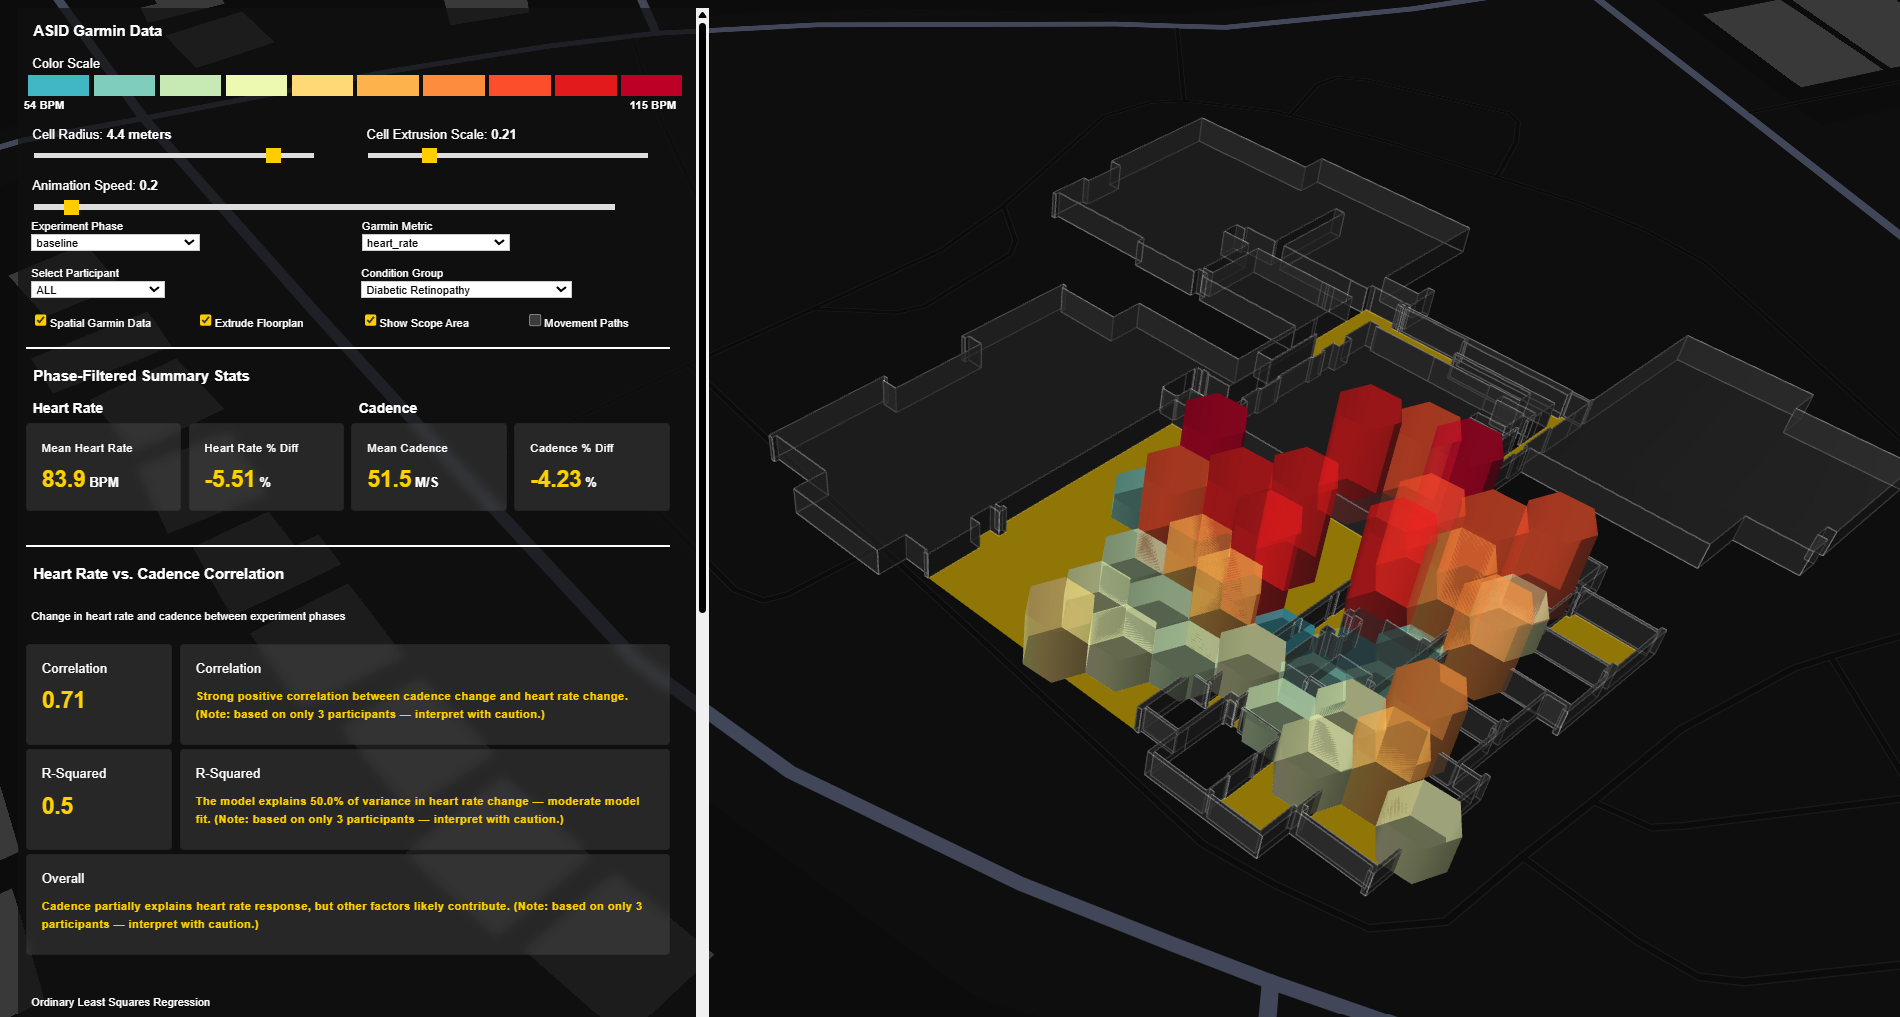
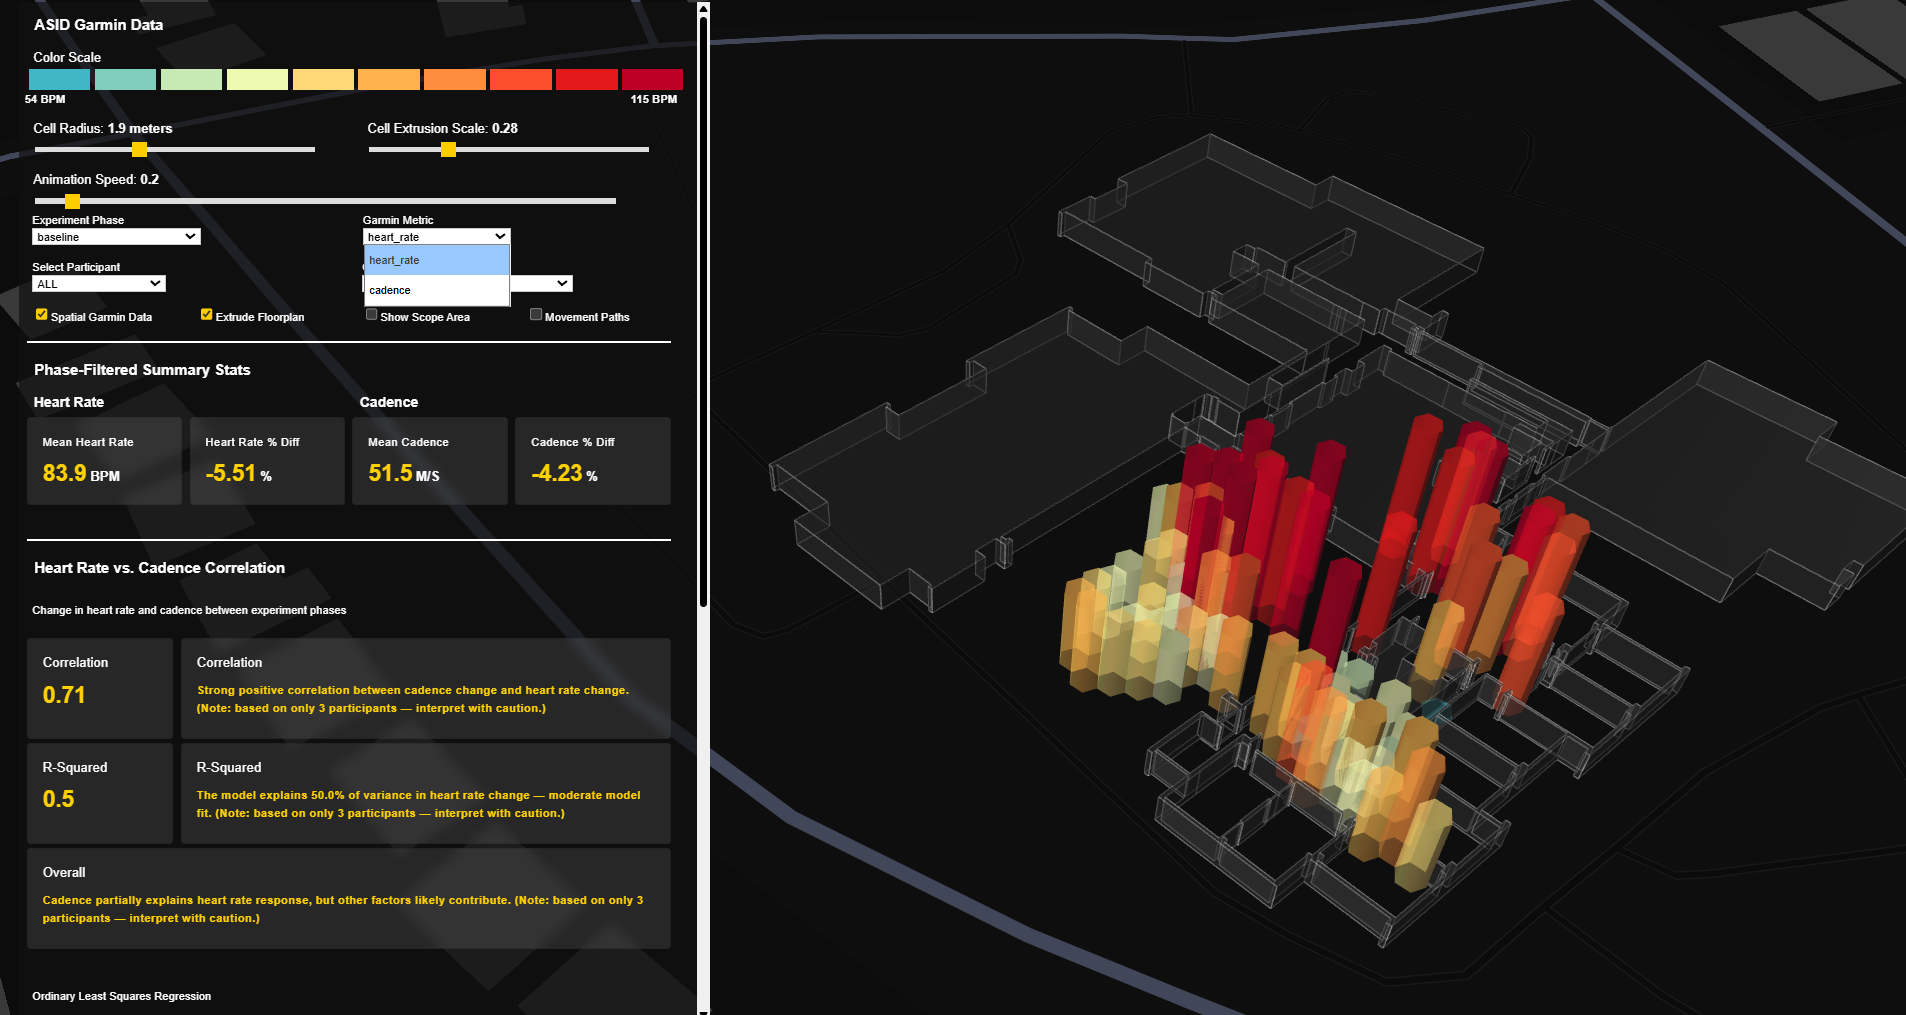
Interactive sliders give the user control over the DeckGL hexbin size for finer or more generalized spatial insights
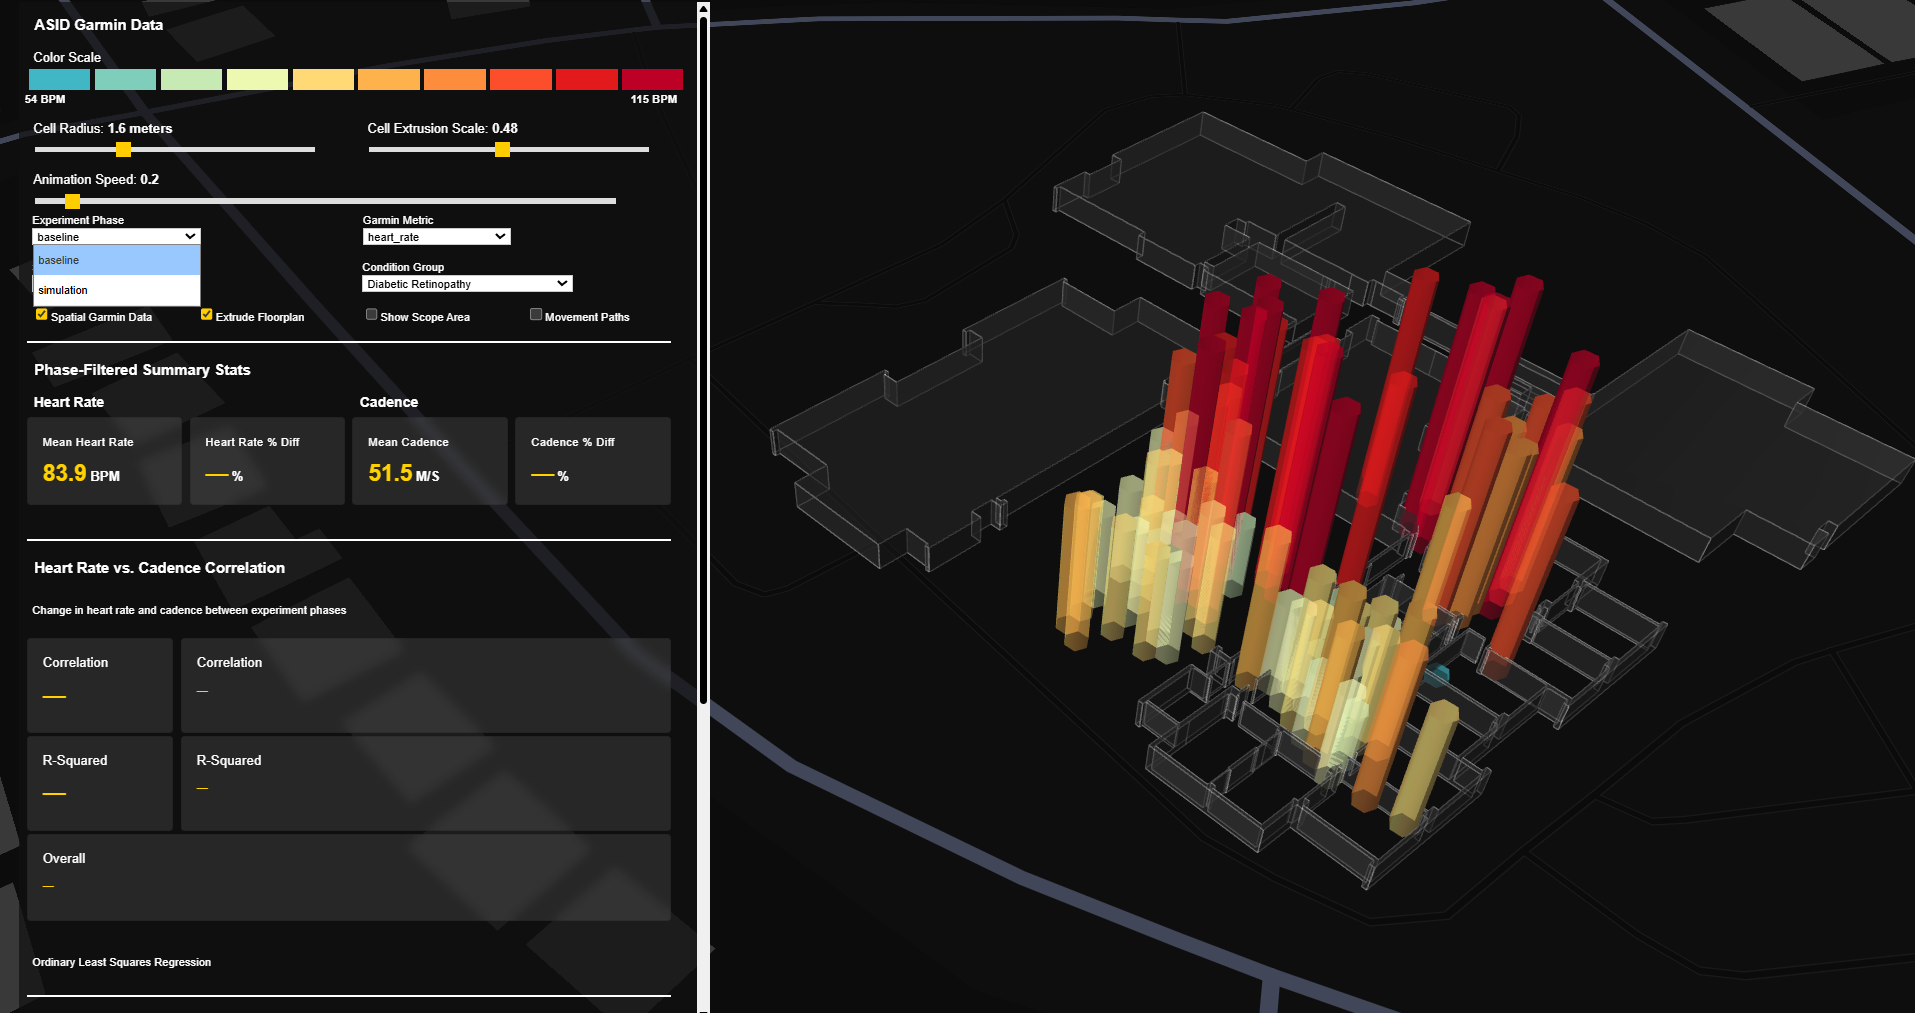
The user can filter between baseline and simulation data,

physiological metrics (heart rate and cadence,
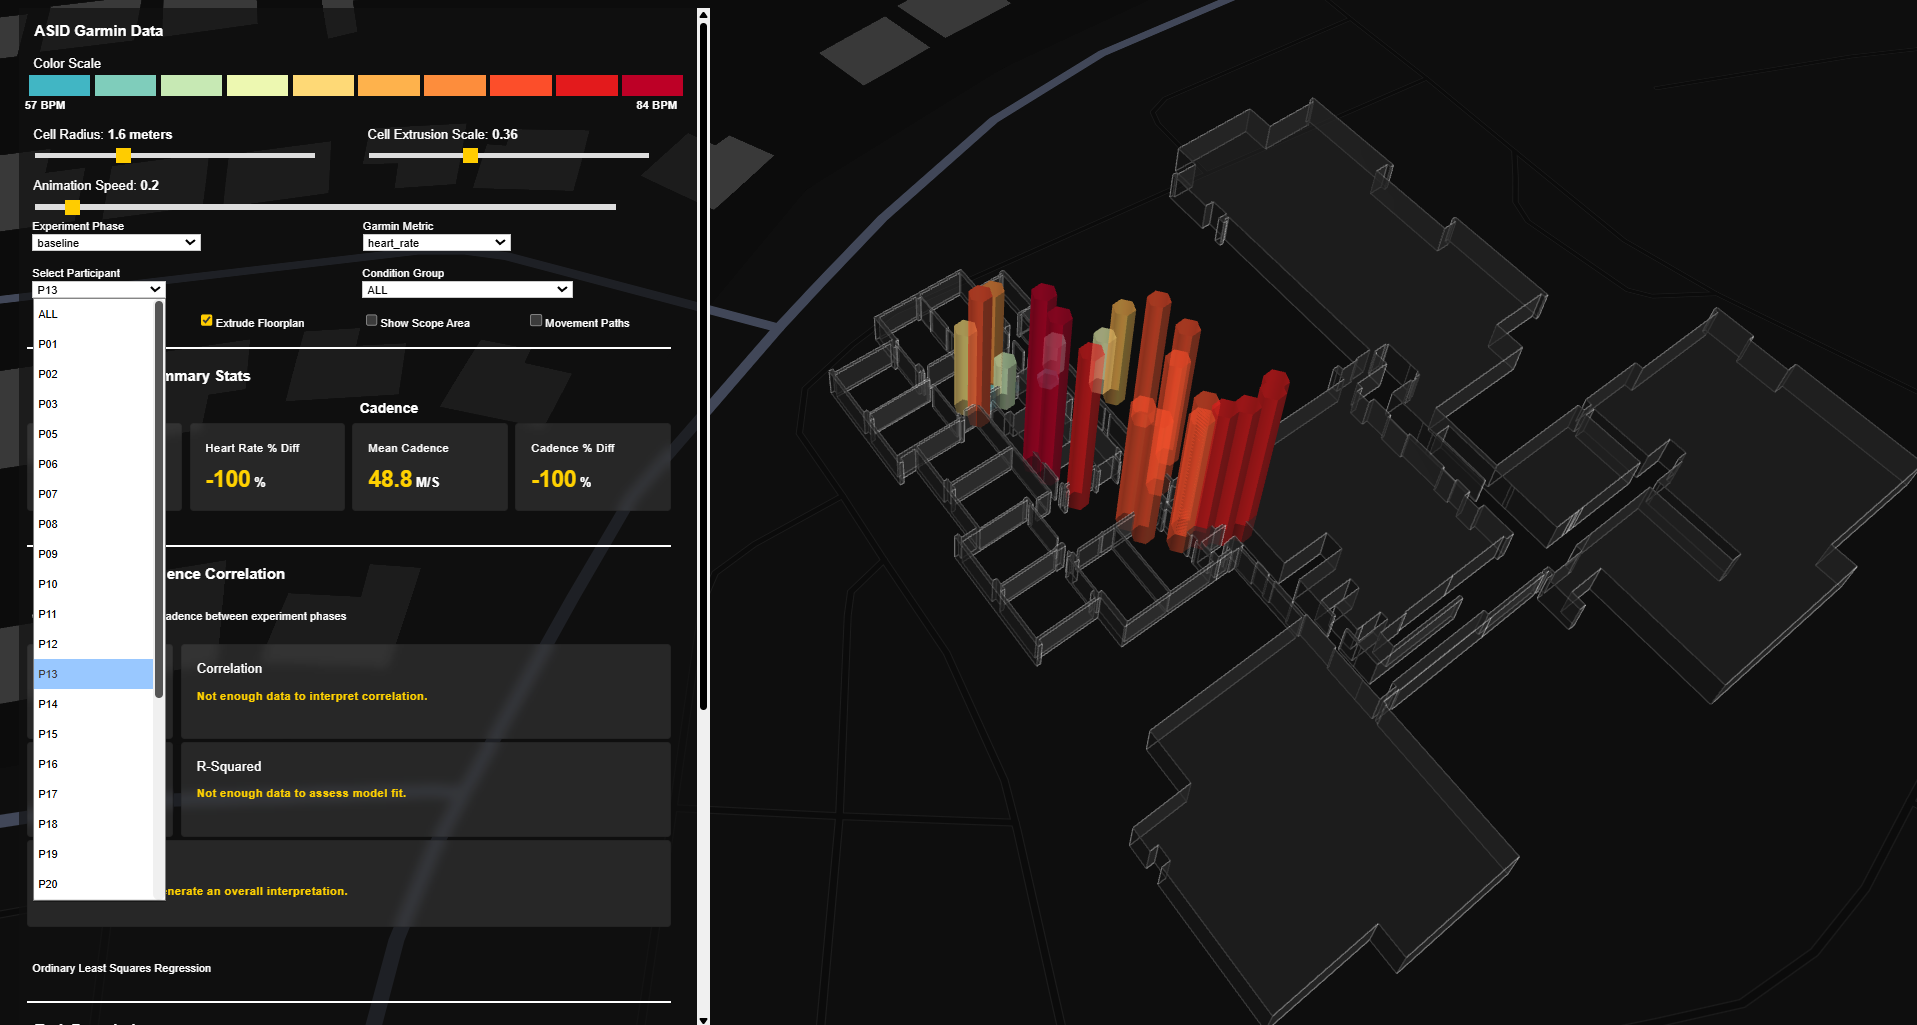
study participants,
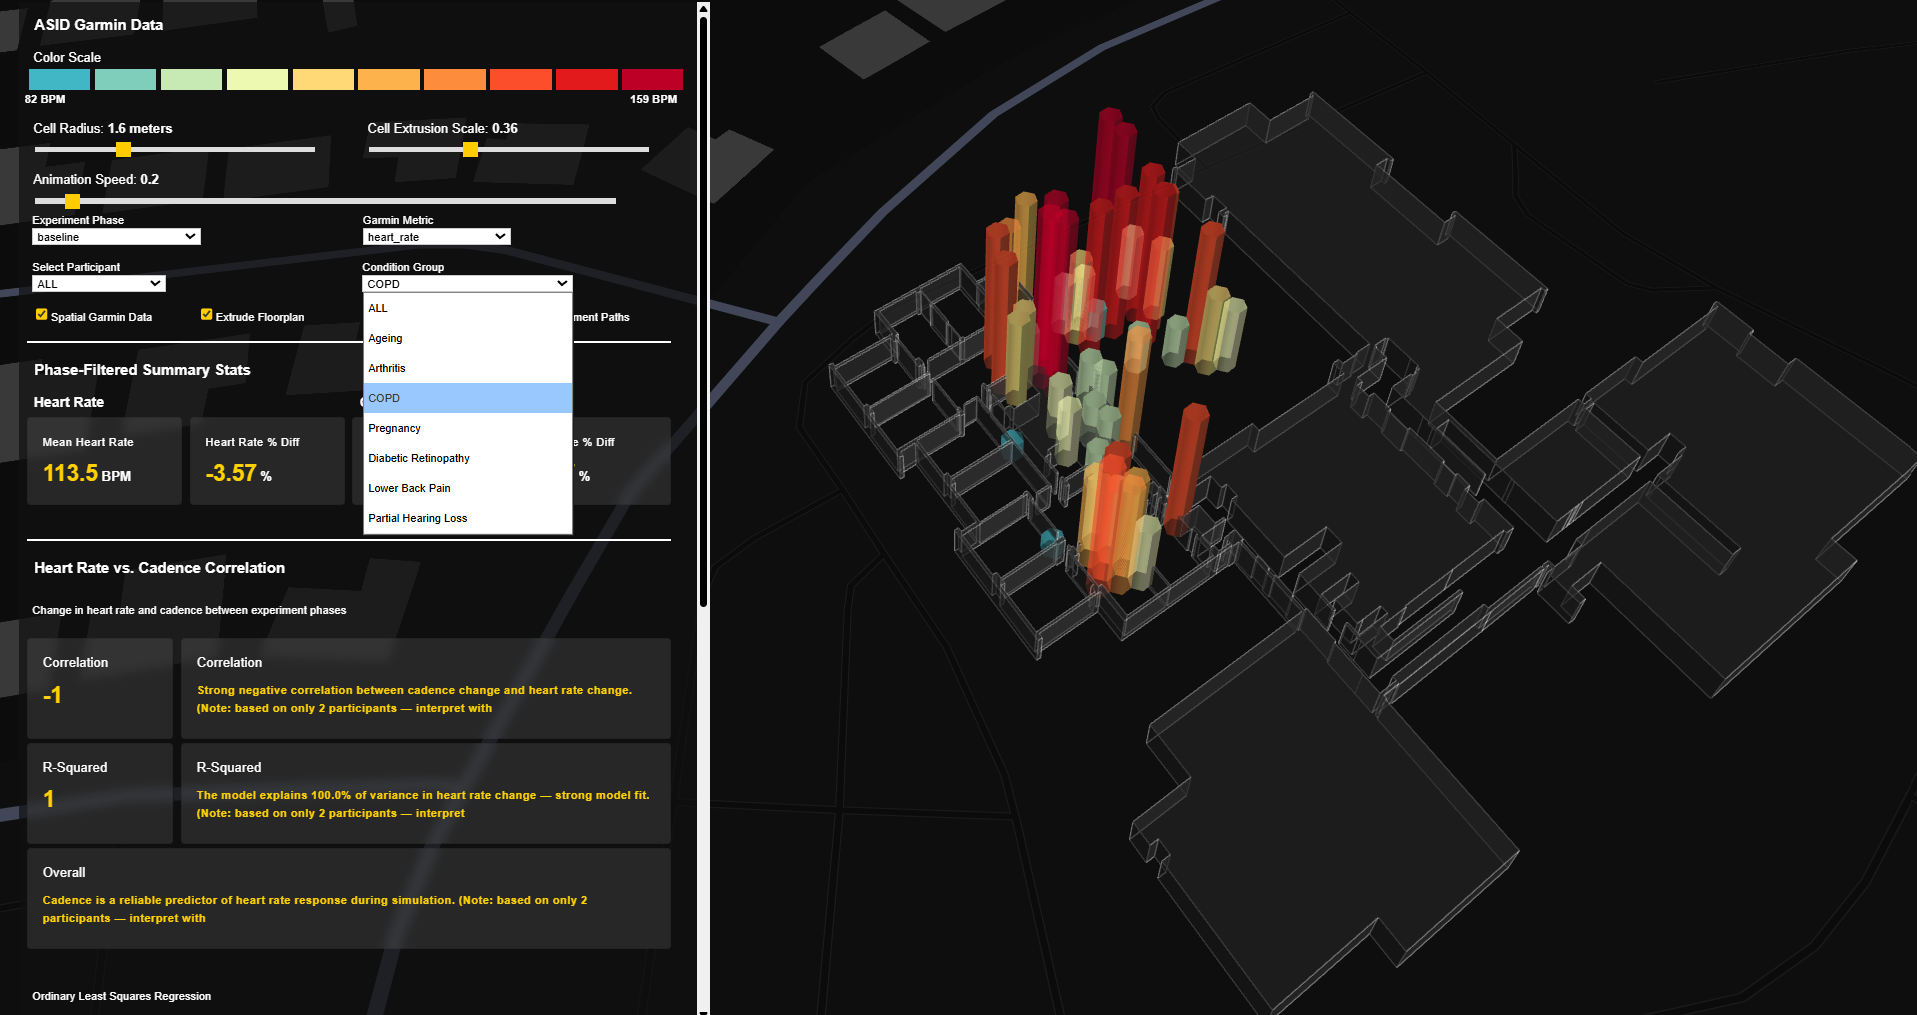
and condition groups.
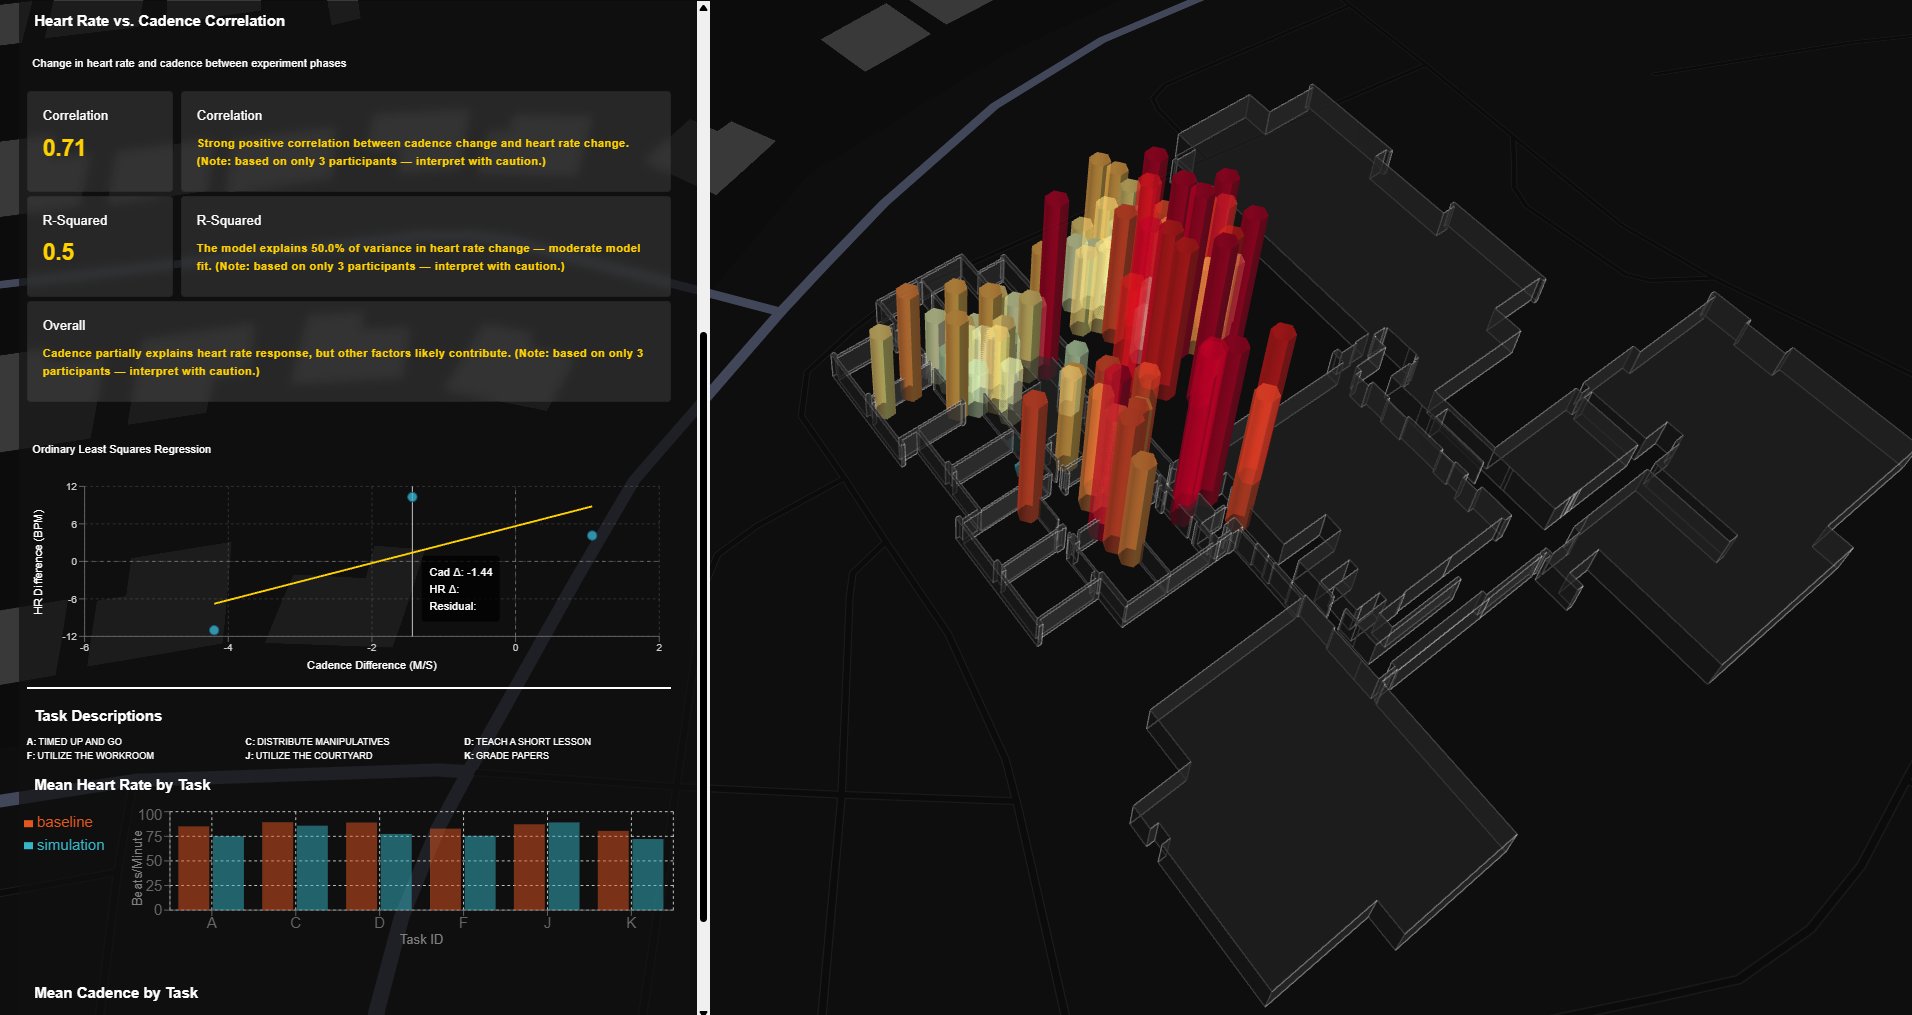
Filtered data is piped into a ML layer, where OLS regression returns correlation metrics. The model output is interpreted by a series of conditional logical layers to interpret the results into plain text.