Long Haul Ag-Freight
This project investigated freight flows of agricultural goods in the US to visualize how far food goods travel farm to market and assess the impact of ag-freight on transportation infrastructure, cities and the environment. In order to conduct this investigation, data from numerous sources was collected and custom data analysis programs were written to combine and analyze the data in a single comprehensive model.
The investigation began by collecting data from the US Bureau of Transportation Statistics' Commodity Flow Survey (CFS), which provides an aggregated look at origin-destination freight flows of various commodities including agricultural goods. The data designated materials and goods with harmonized system codes which allowed for specific types of freight flows to be filtered and isolated. The CFS allows data to be filtered by mode of transport such as by truck, train, barge, multimodal etc. During the data exploration phase, it was decided to focus on a single, prominent mode of transportation with significant impact to transportation and city infrastructure, so freight movements by refrigerated trucks became the focus.
Freight flow data from the USDA' Agricultural Market Service on freight movement by refrigerated trucks was collected along with several sets of reference documents and data sets which were necessary to map the freight flow data geogra. For example, the freight flow data provided origin and destination by USDA district and designated metro areas but did not provide actual geographic locations. Additionally, many of the place names were not consistent in naming conventions and formatting. Therefore a significant effort was put into manually updating the reference sets with a standardized naming conventions and geographic coordinates for each origin/destination. This process, though tedious, provided an opportunity to better understand the geographic tabulation systems used by different government agencies.
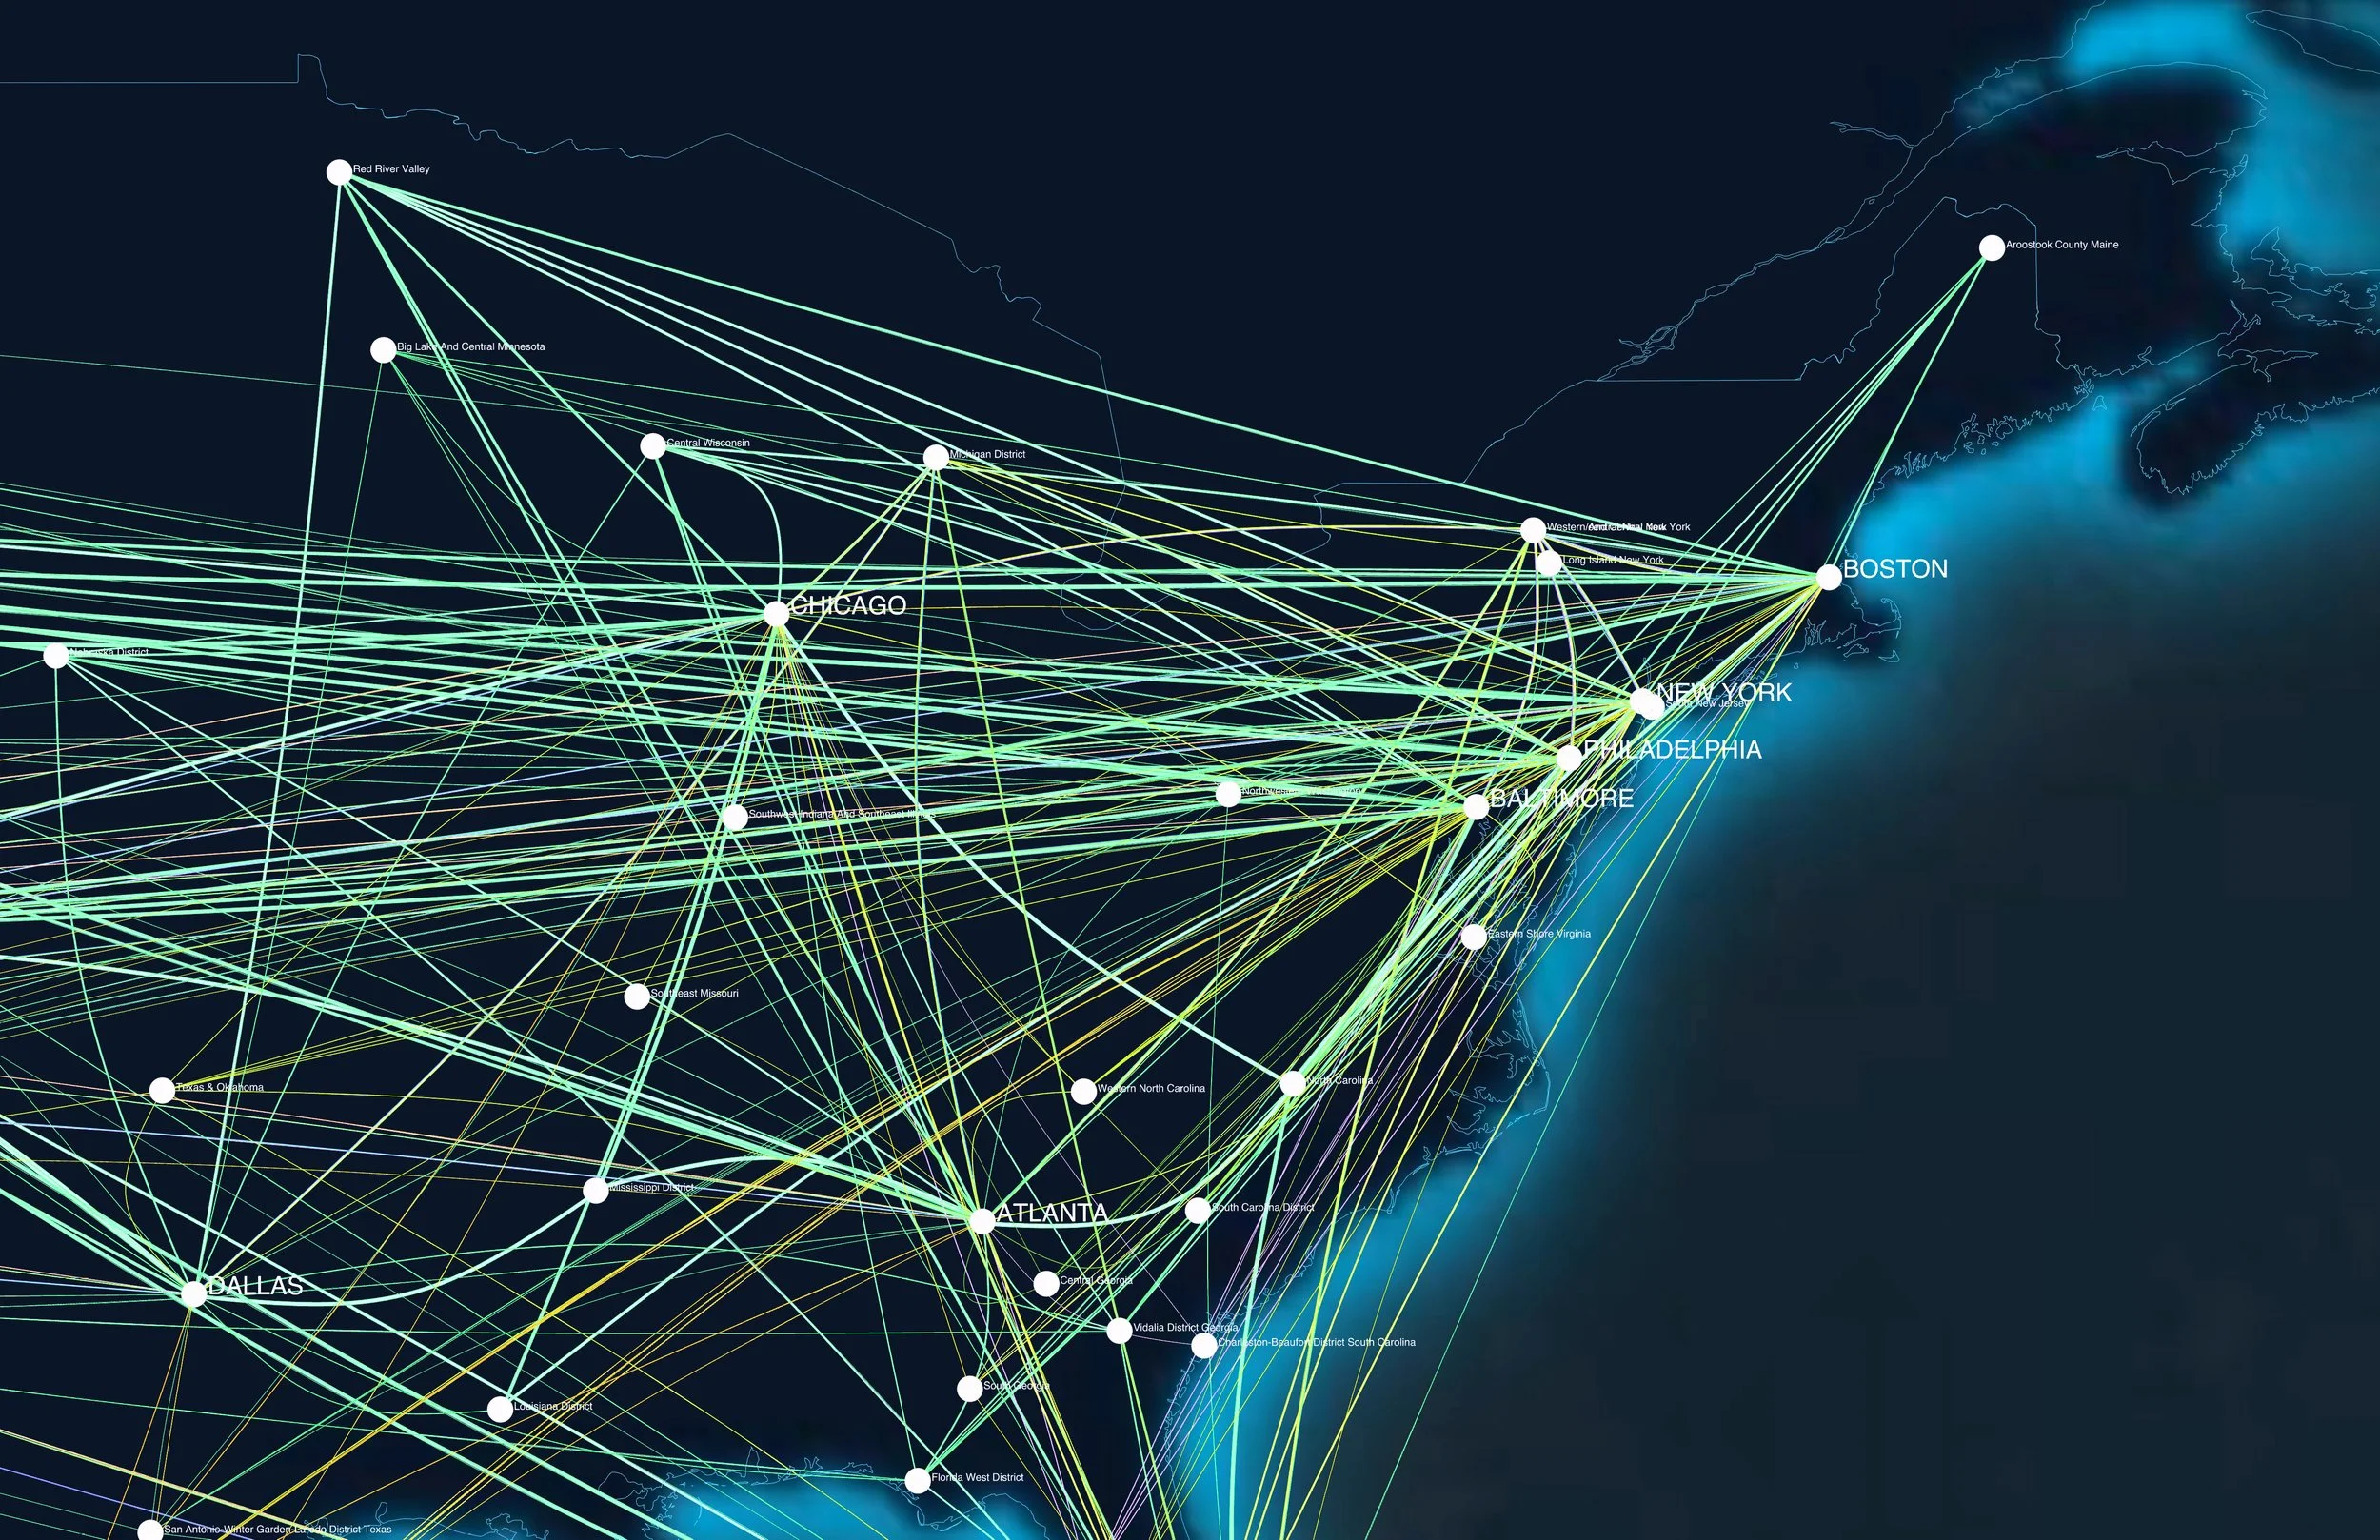
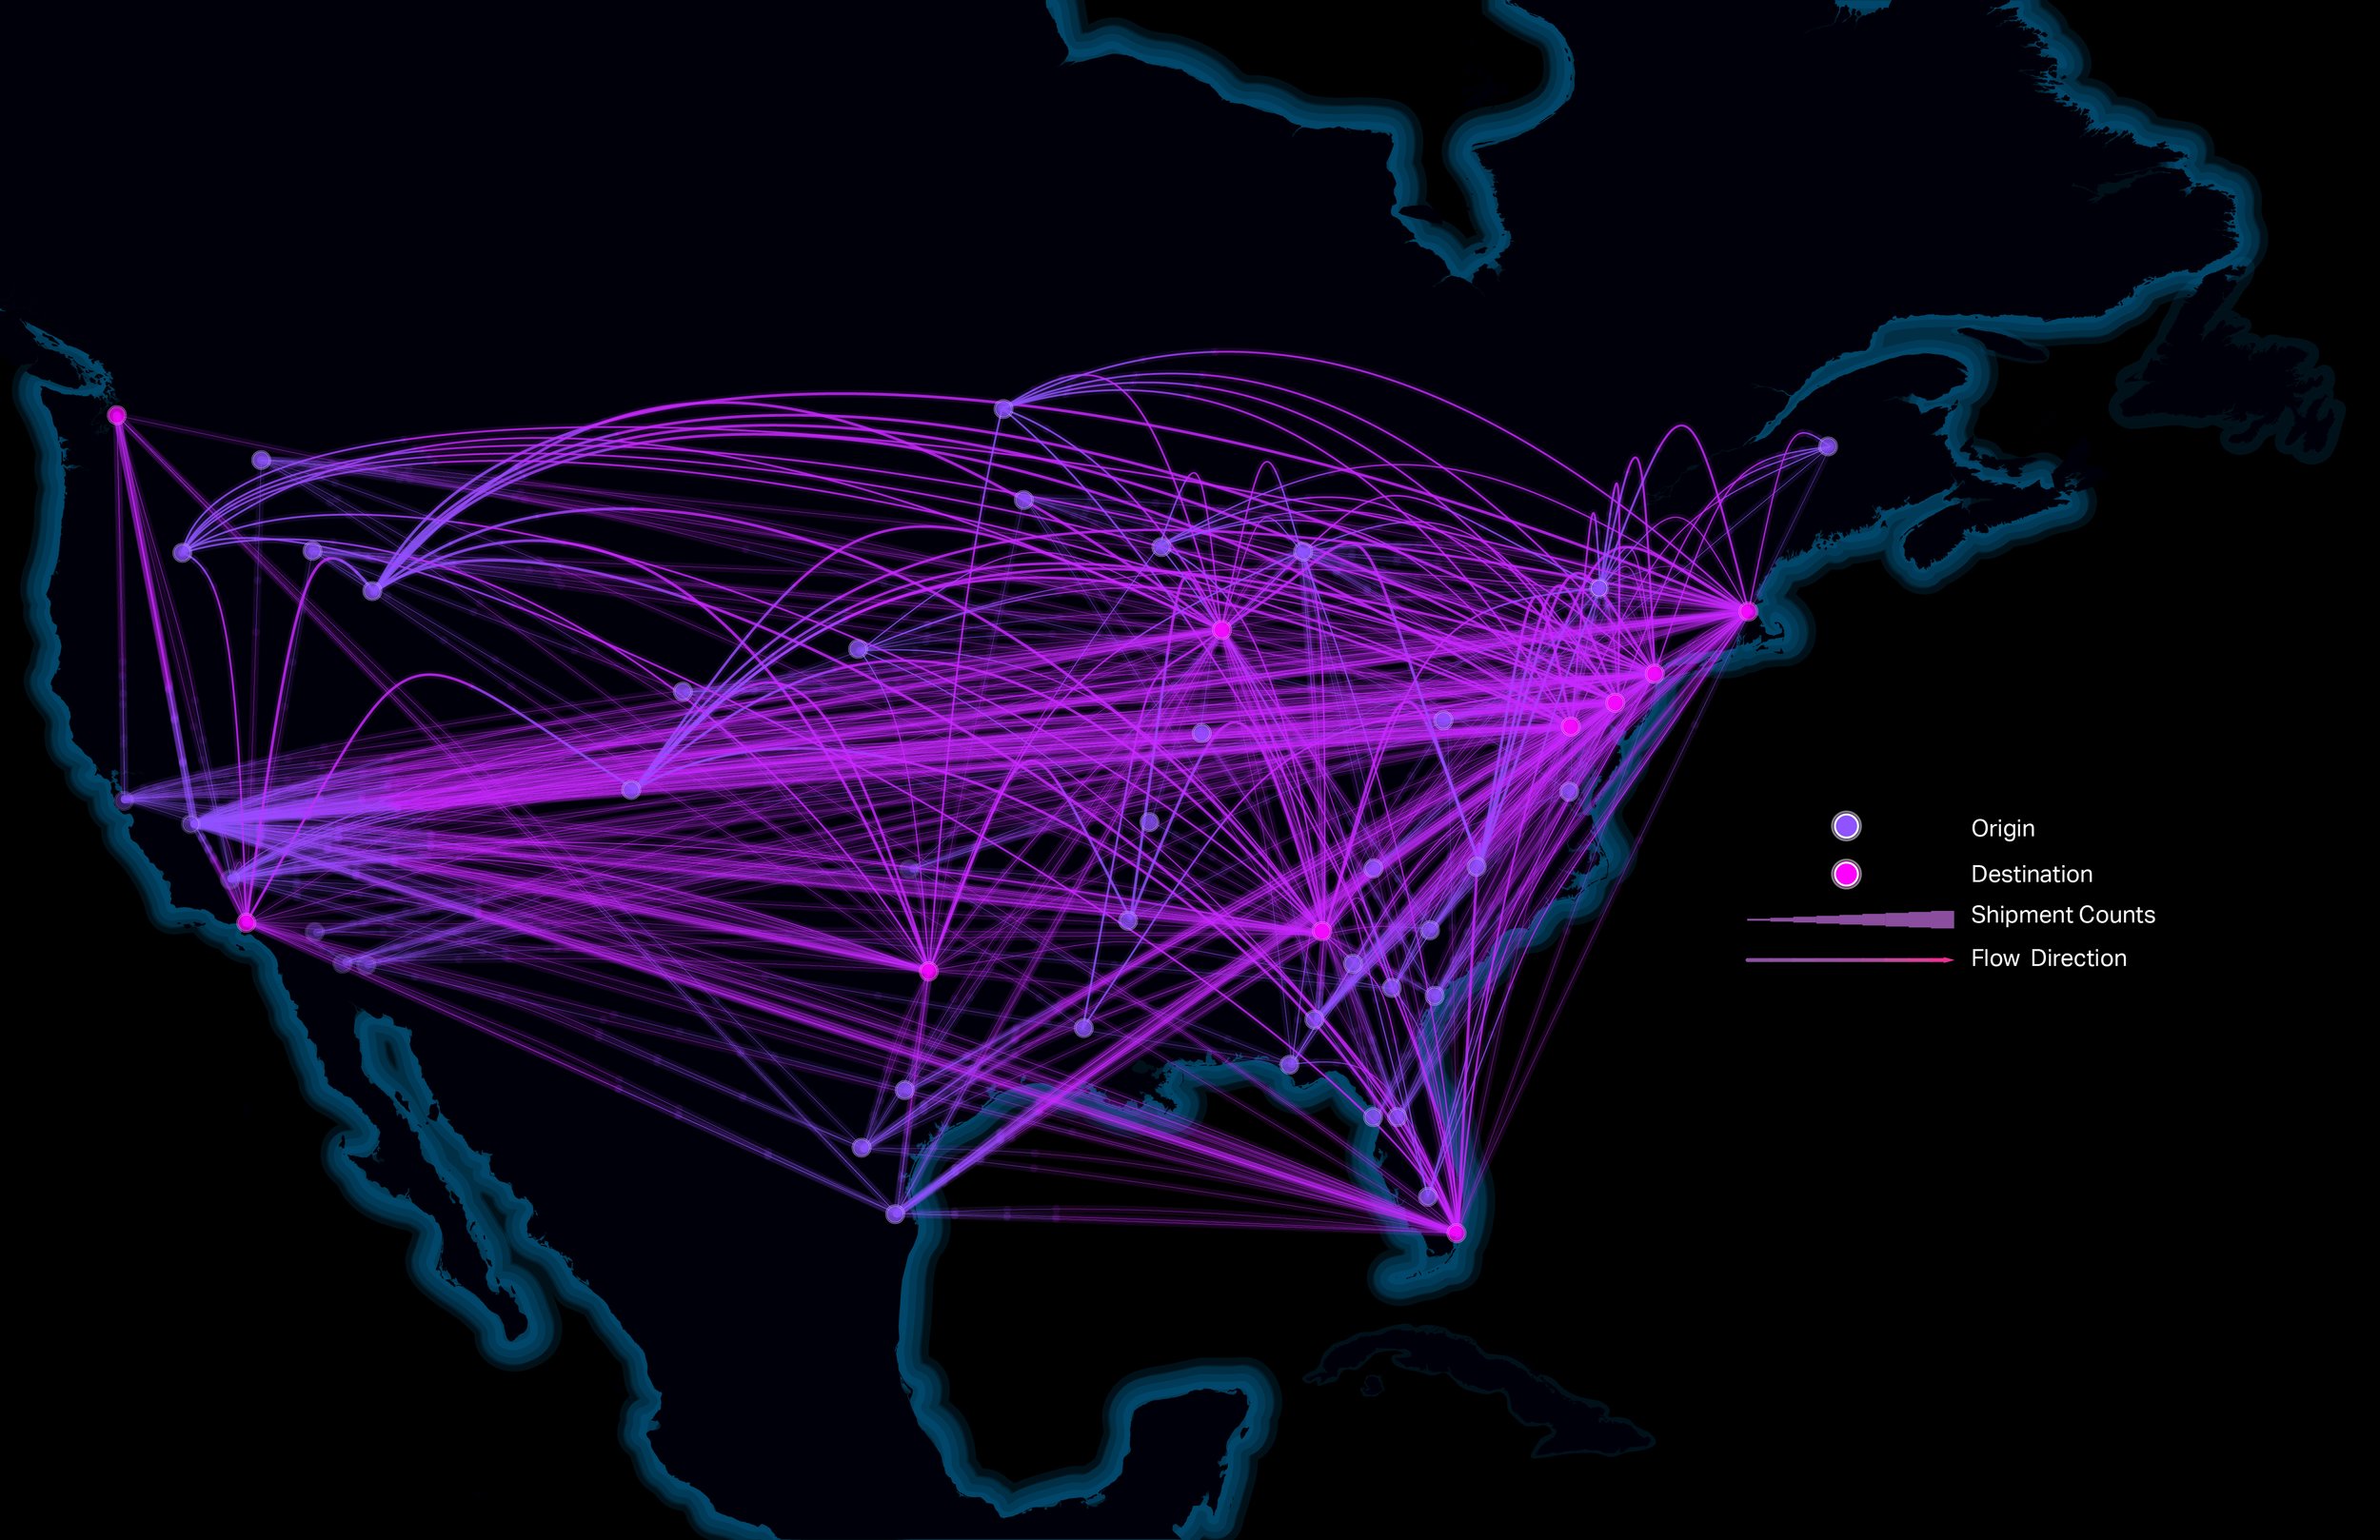
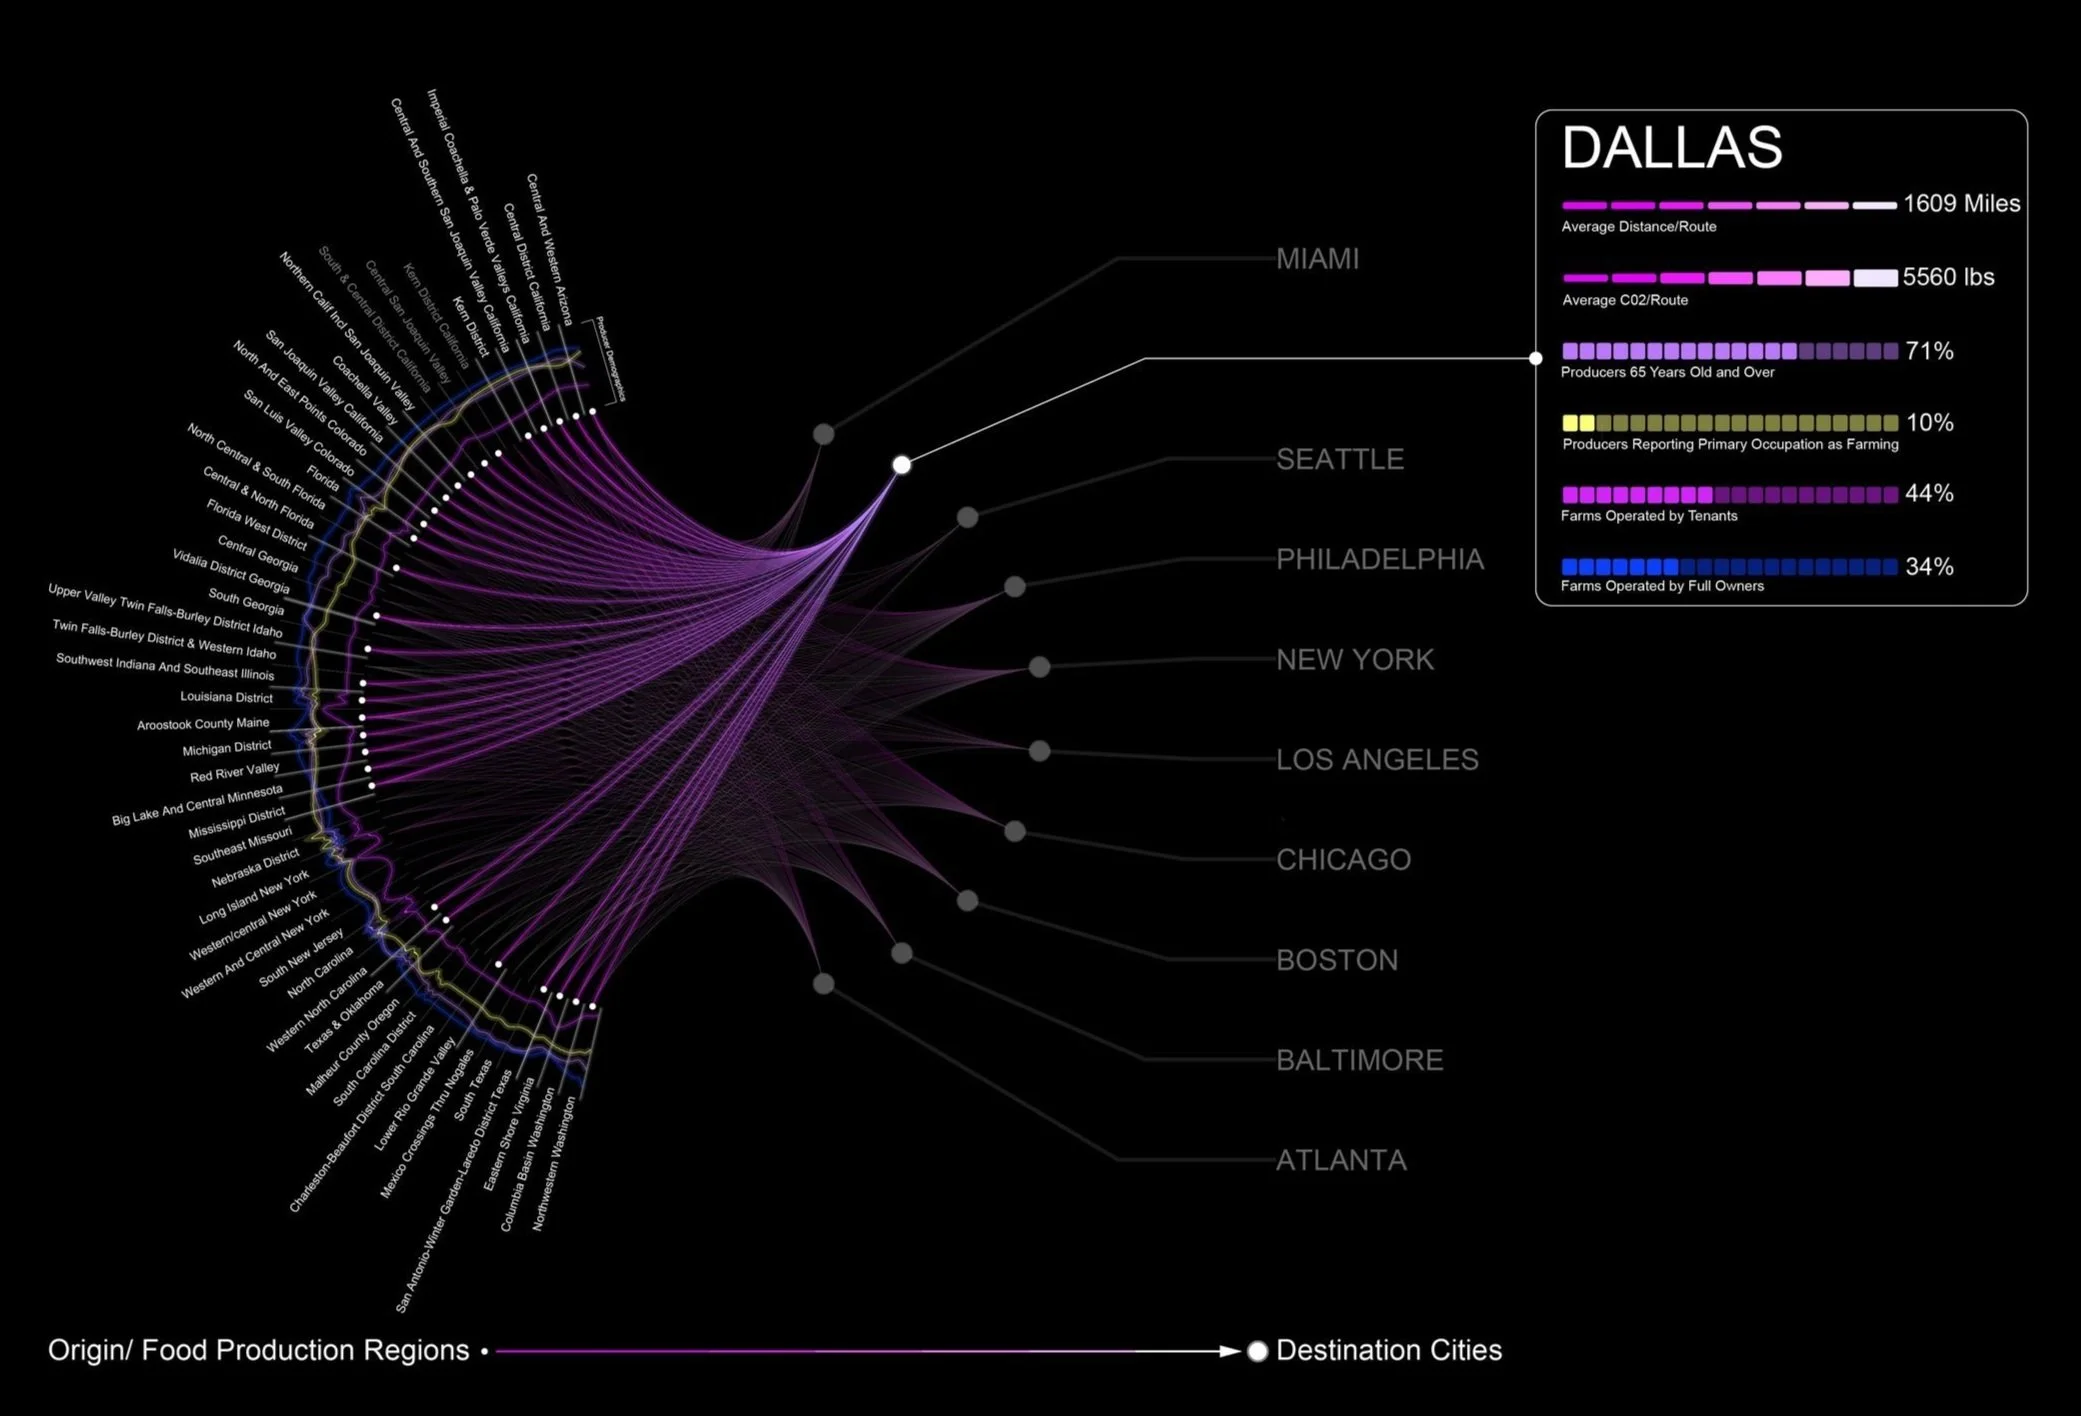
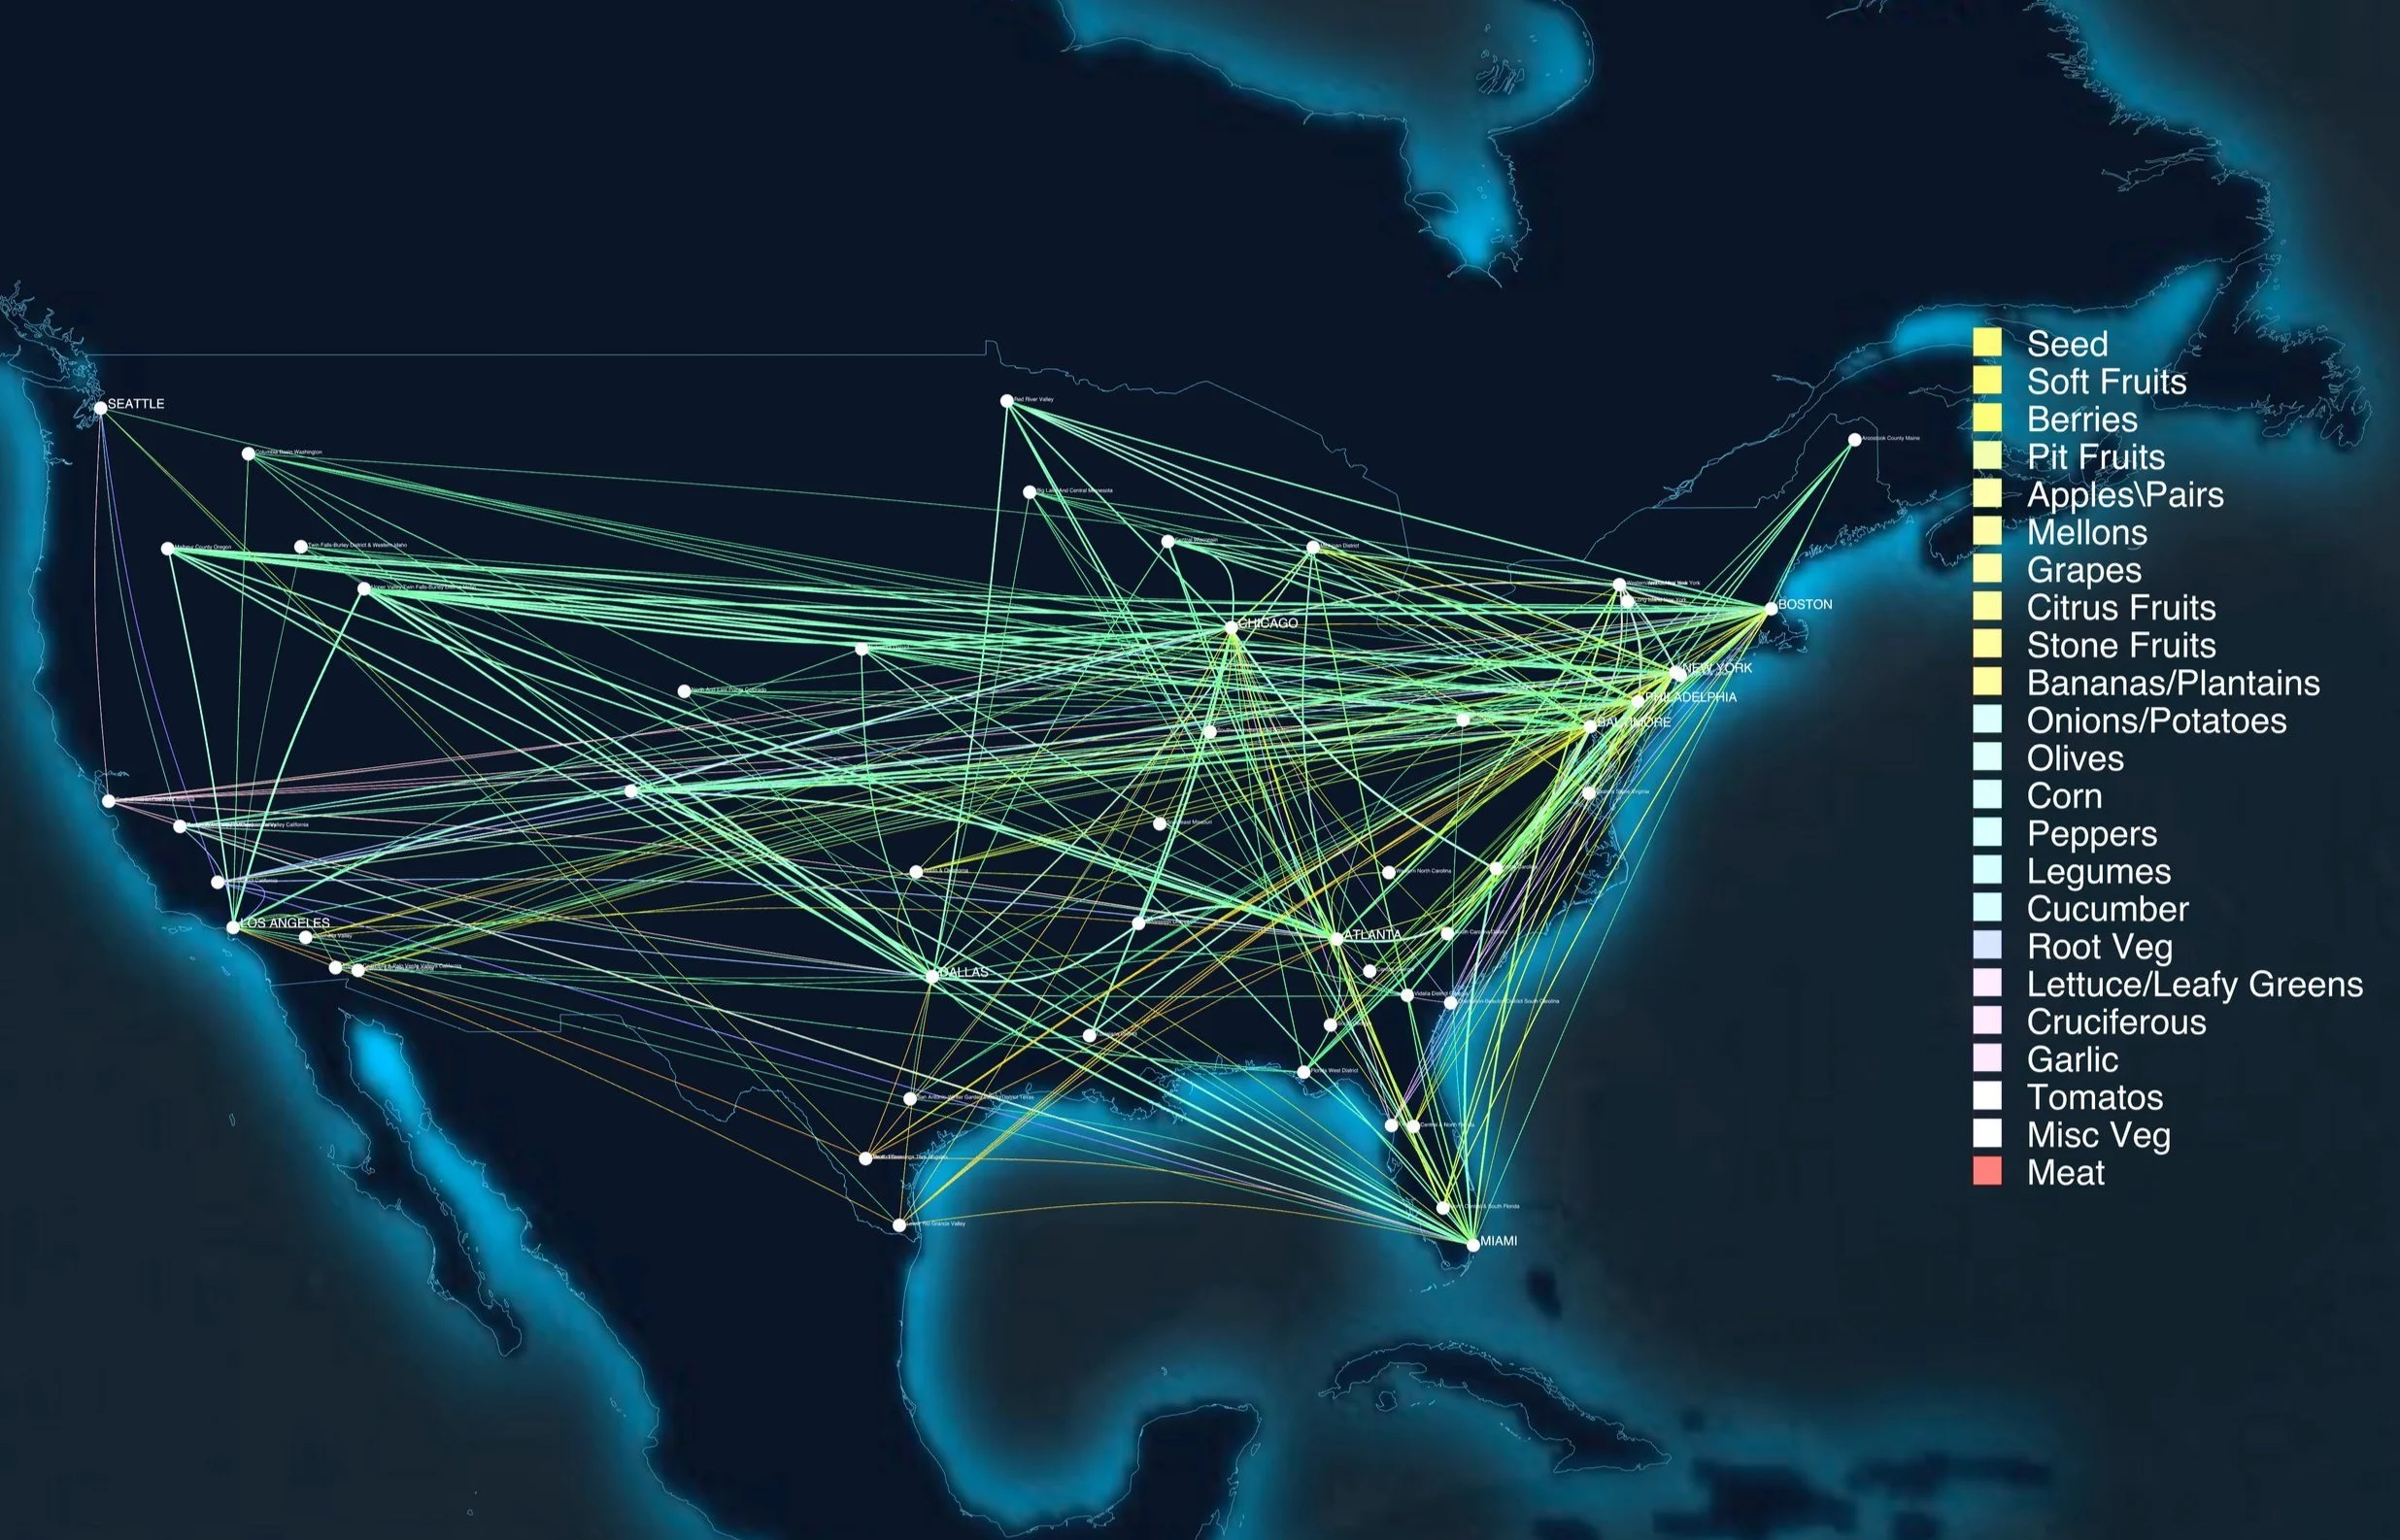
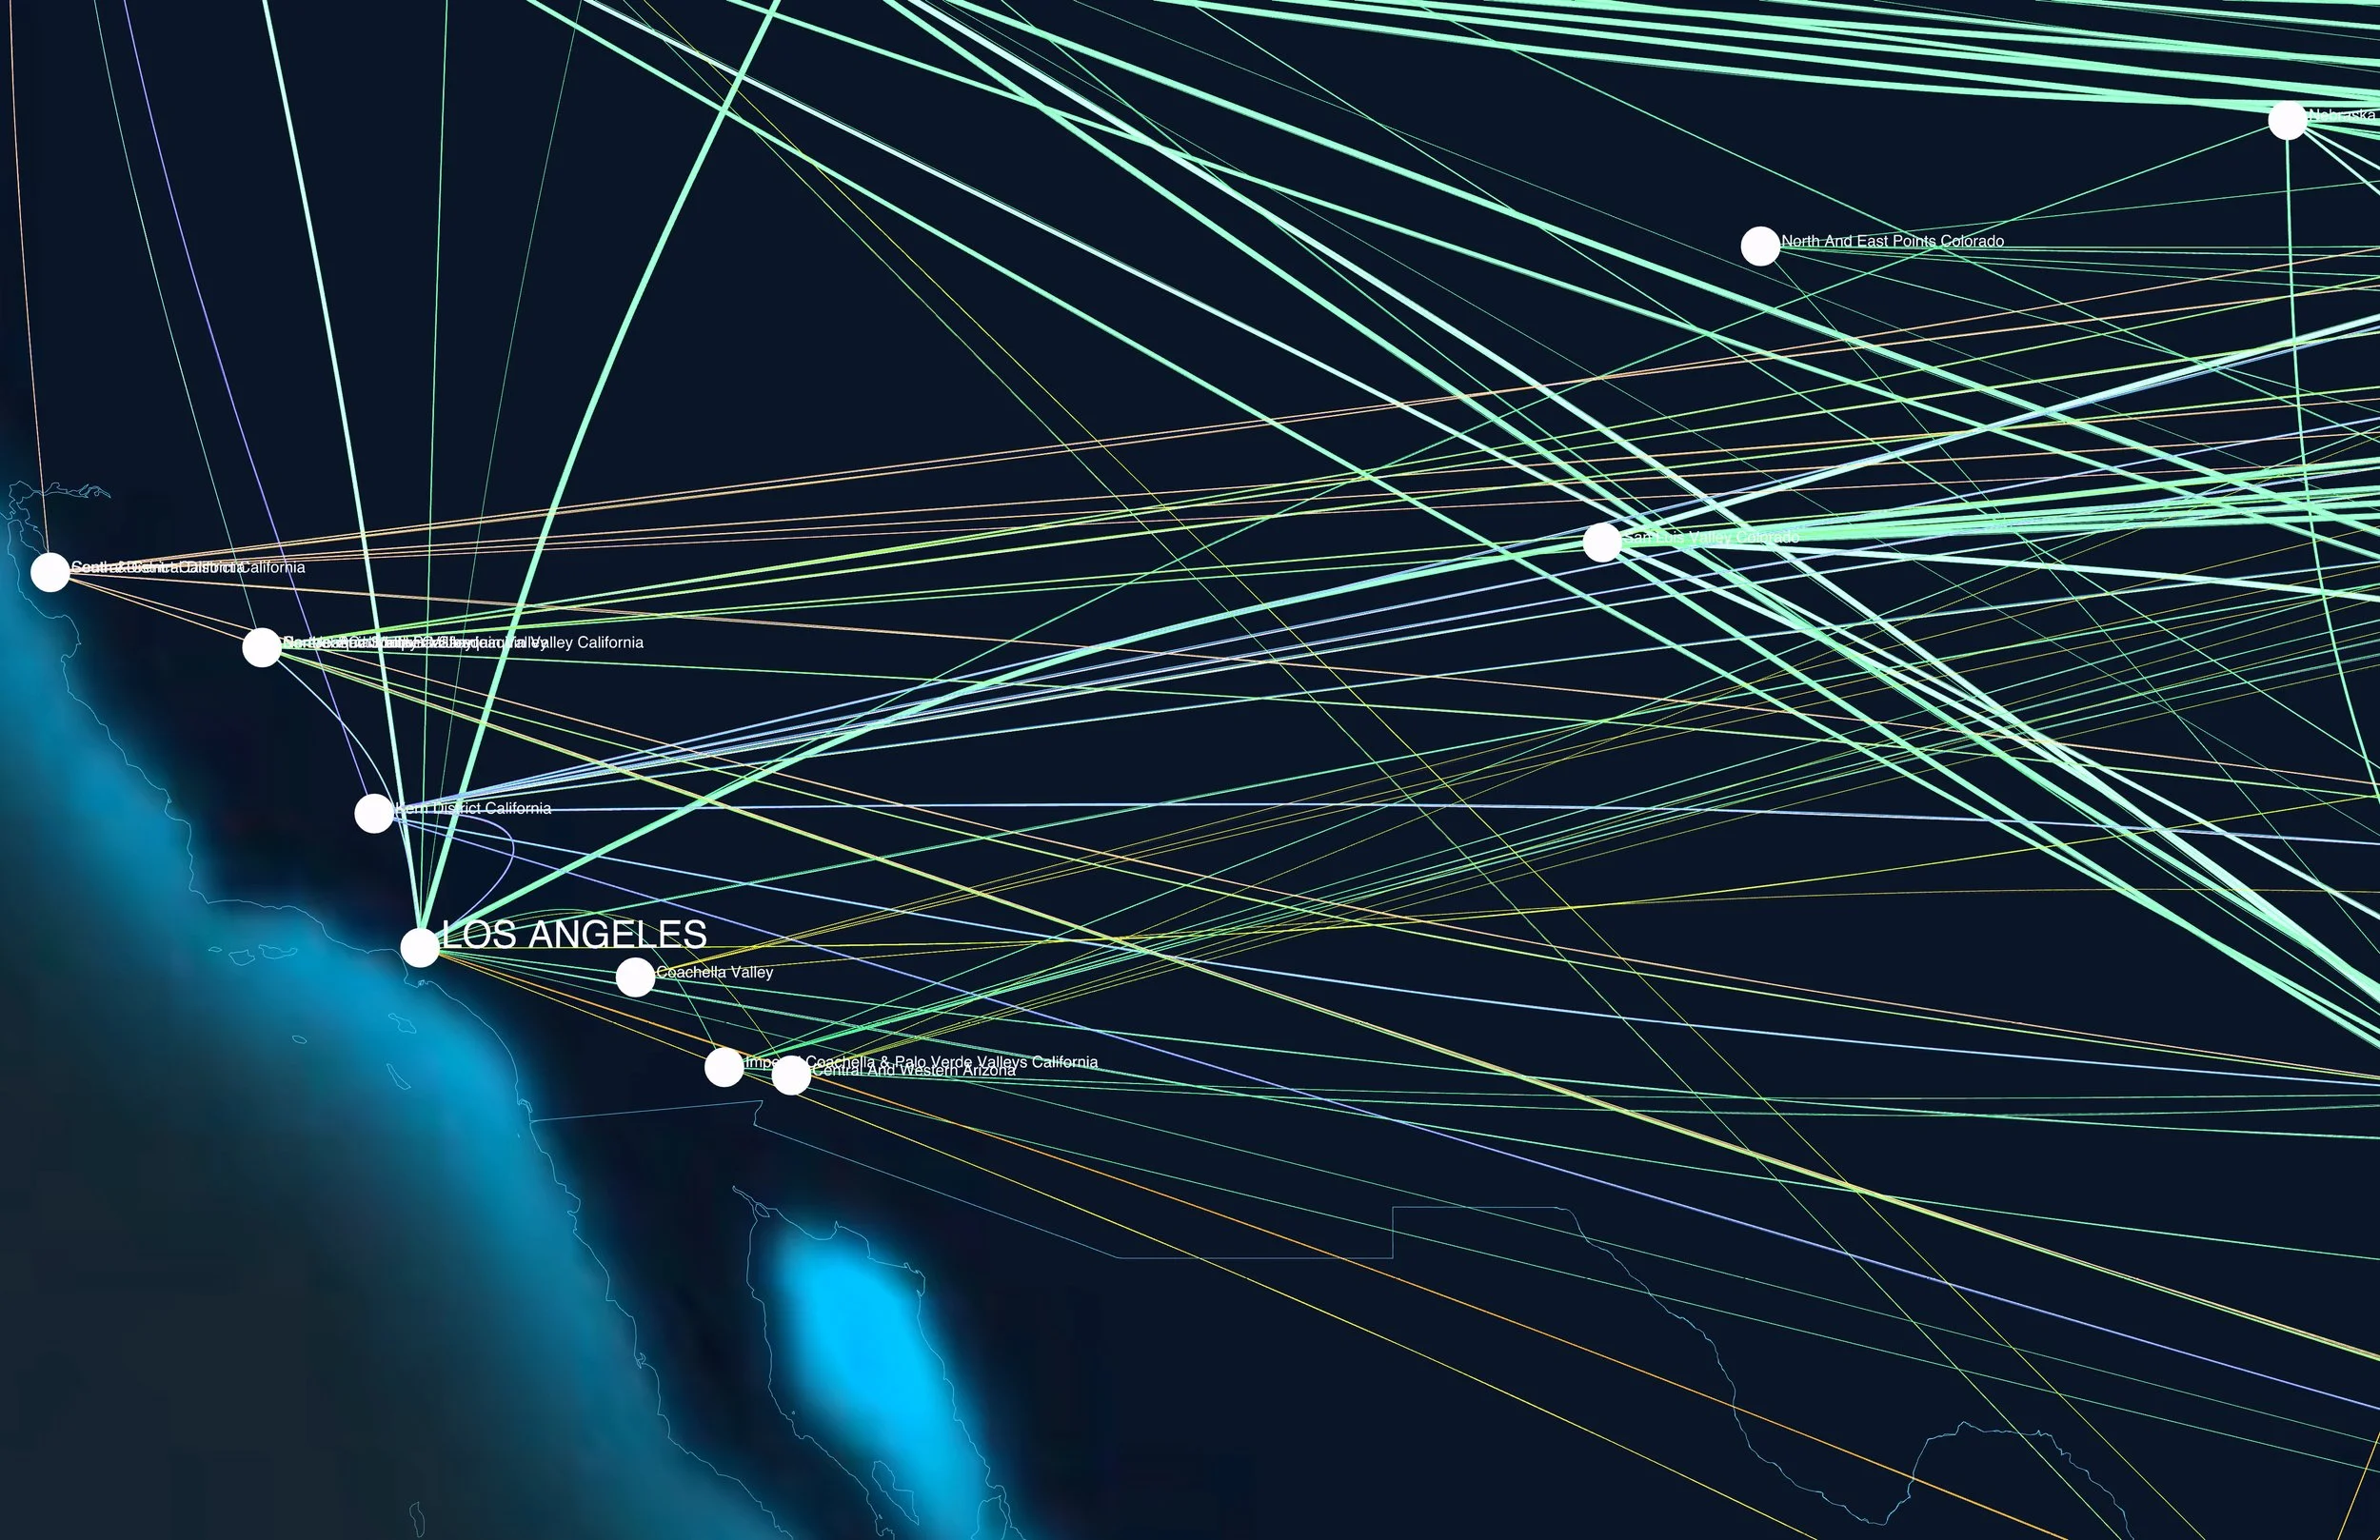
Once the data was finally ready for analysis and visualization, custom tools primarily written with Python and Grasshopper (in Rhino) were developed to make an interactive data analysis and visualization model. The model visualizes freight flows by generating a Bezier curve between the origin and destination and modifying the curve based on the magnitude of freight flow, which was derived from the total amount of freight in pounds transported on that particular route. The radial graphic allows the user to select a specific destination city and see all the places where a particular crop is transported from an overall average distance traveled. This data was also used to estimate the carbon footprint of transportation by taking the average highway miles per gallon of a refrigerated truck, average weight of the truck and distance traveled.
Freight Flows by Commodity Type
Scripts
This section’s documentation is in progress and will be updated soon. Python and Grasshopper scripts used for data processing and visualization will be uploaded to Github.
