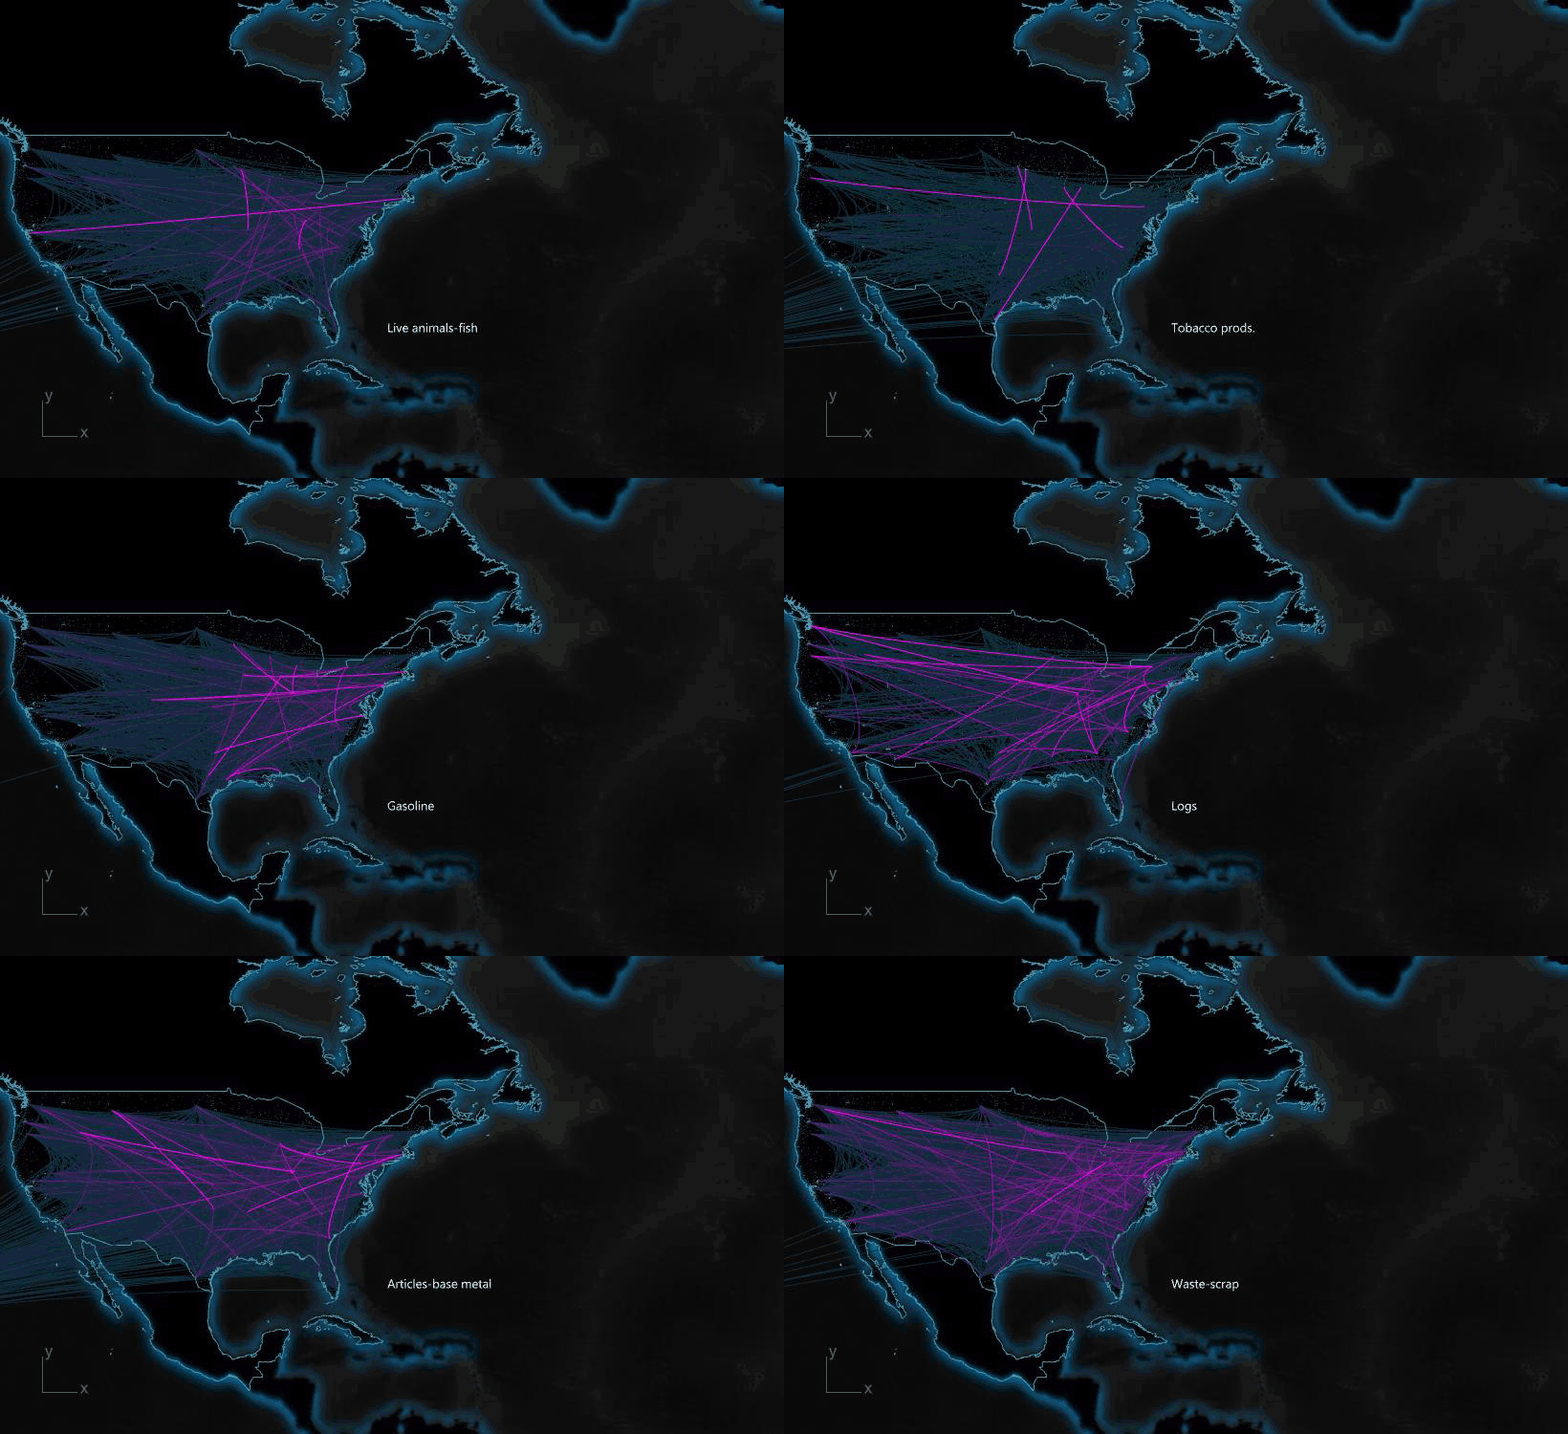
Freight Flow Spatial Patterns
This visualization project was part of a larger effort to understand spatial patterns of domestic freight flow and develop methods and tools to estimate the embodies energy and carbon associated with transportation of goods/materials.
Data sources & Uses
Entity: US Bureau of Transportation Statistics
Resource: 2017 CFS (Commodity Flow Survey)
Use: CFS contains directional freight flow data by designating the origin and destination of the flow (as USDA NAAS district names), aggregated by commodity type and mode of transportation.
Entity: US Census Bureau
Resource: Gazetteer Files
Use: This collection of geographic reference files were used to calculate the locations of freight flow start and end points. Eg. The Gazetteer files contain the latitude and longitude of individual census tracts and their associated state and county FIPS codes. The FIPS codes were used to group census tracts by their respective counties and used to calculate the mean centroid of the county. The county centroids were then grouped by USDA NAAS districts and used to calculate the mean centroid of each district.
Entity: International Trade Administration
Resource: Harmonized System (HS) Codes
Use: HS codes were used primarily for deeper analysis of freight flows pertaining to agricultural commodity. The HS codes were split into groups based on the type of agricultural commodity the code identified.

Visualization process diagram
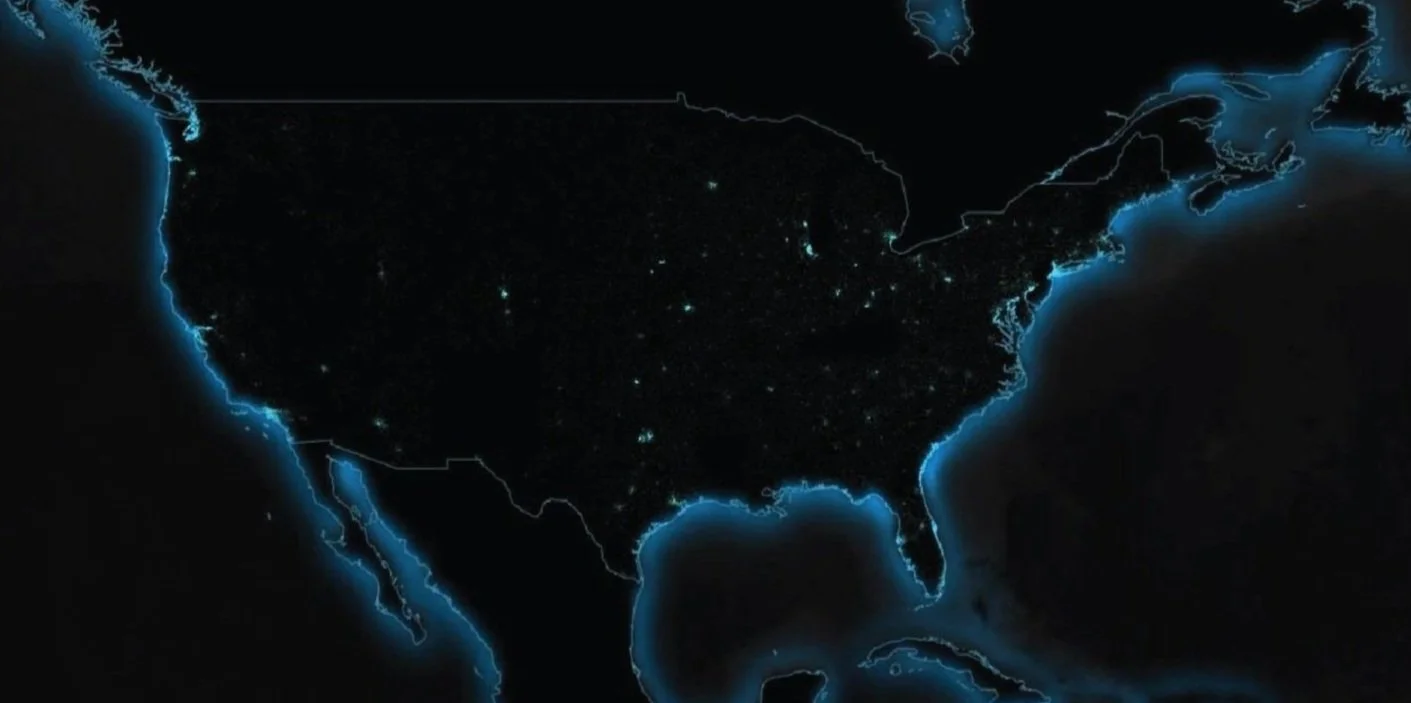
Plot centroids of US counties.
Use an “evaluate curve” node to move the start and end points of the vector by a factor of “d”.
“d” (distance) is plugged into function “f” (a compression function) and used as the magnitude input parameter to the “evaluate curve” node.
Use the new start and end points (a’, b’) to create a new vector. Take the midpoint (M) of the new vector. Use the coordinates of point m to calculate the relative center (RC) between all M points.
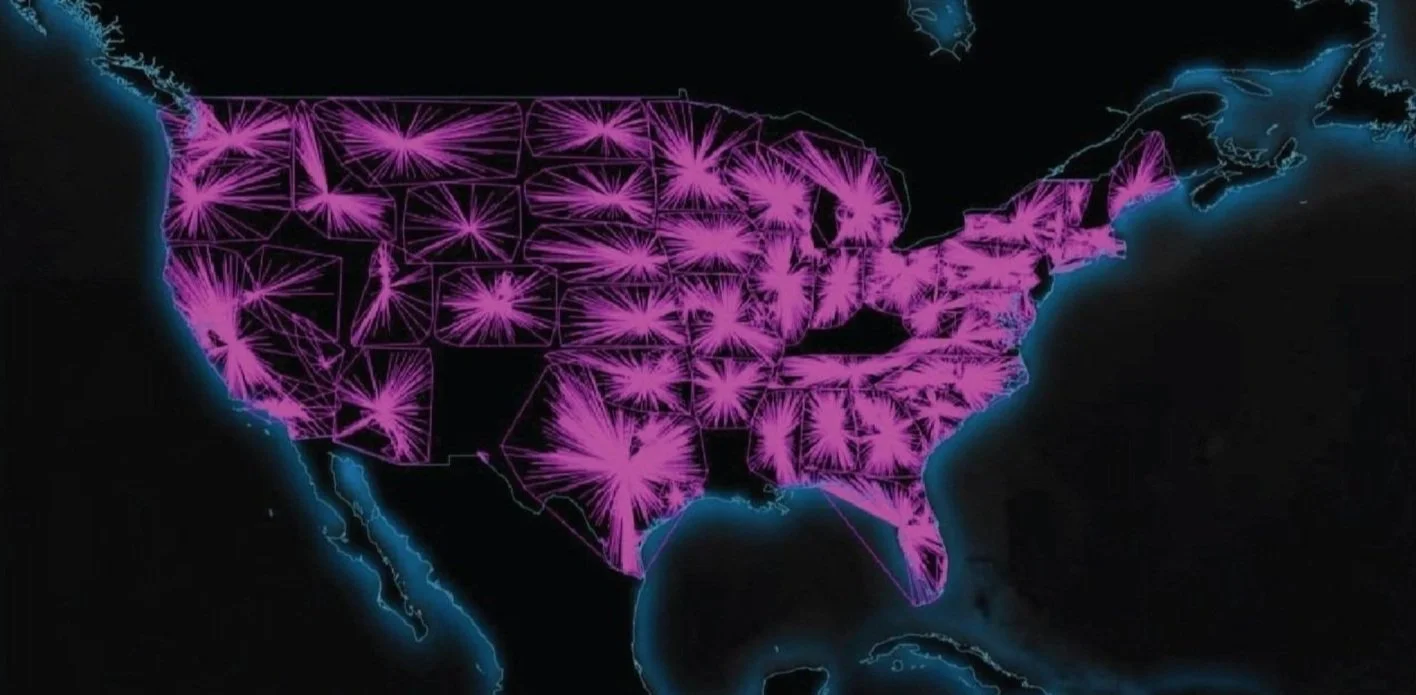
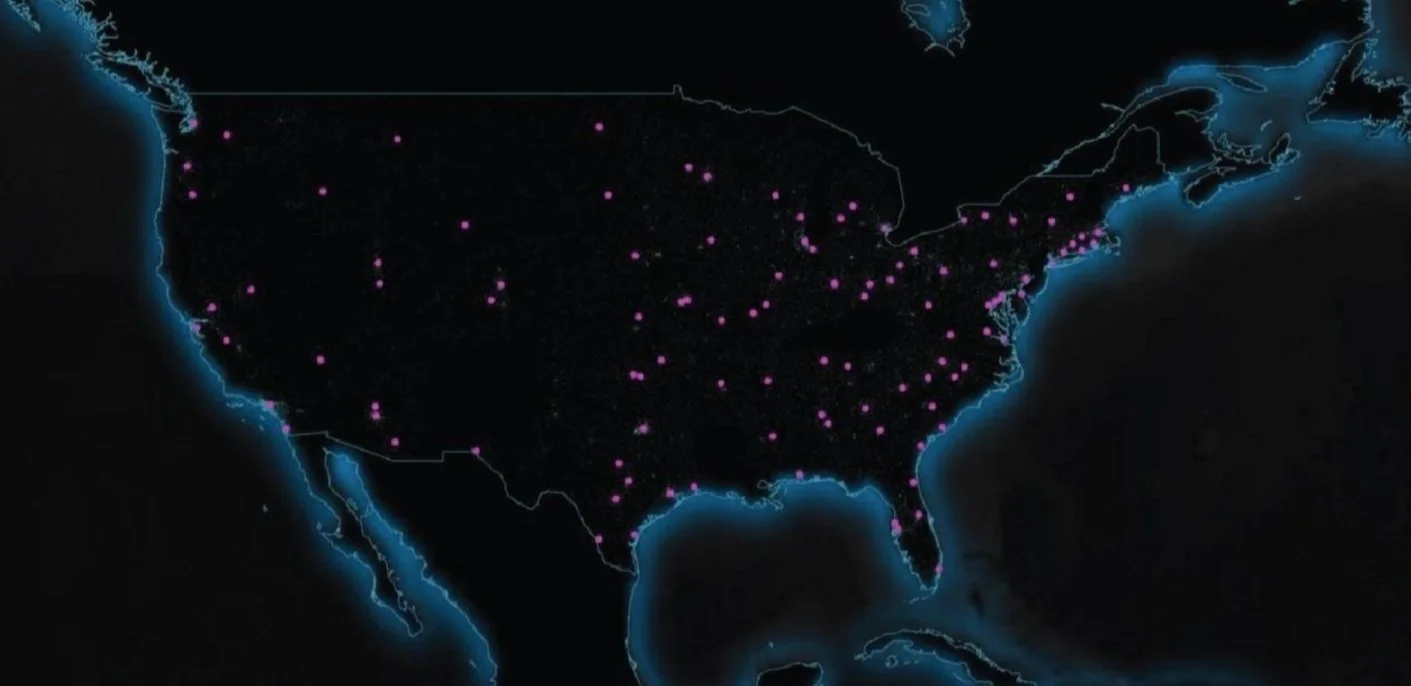
Group US county centroids by USDA NASS districts. Calculate the mean center of the district.
USDA NASS district centroids will be used as freight flow origin and destinations to construct the flow vectors.
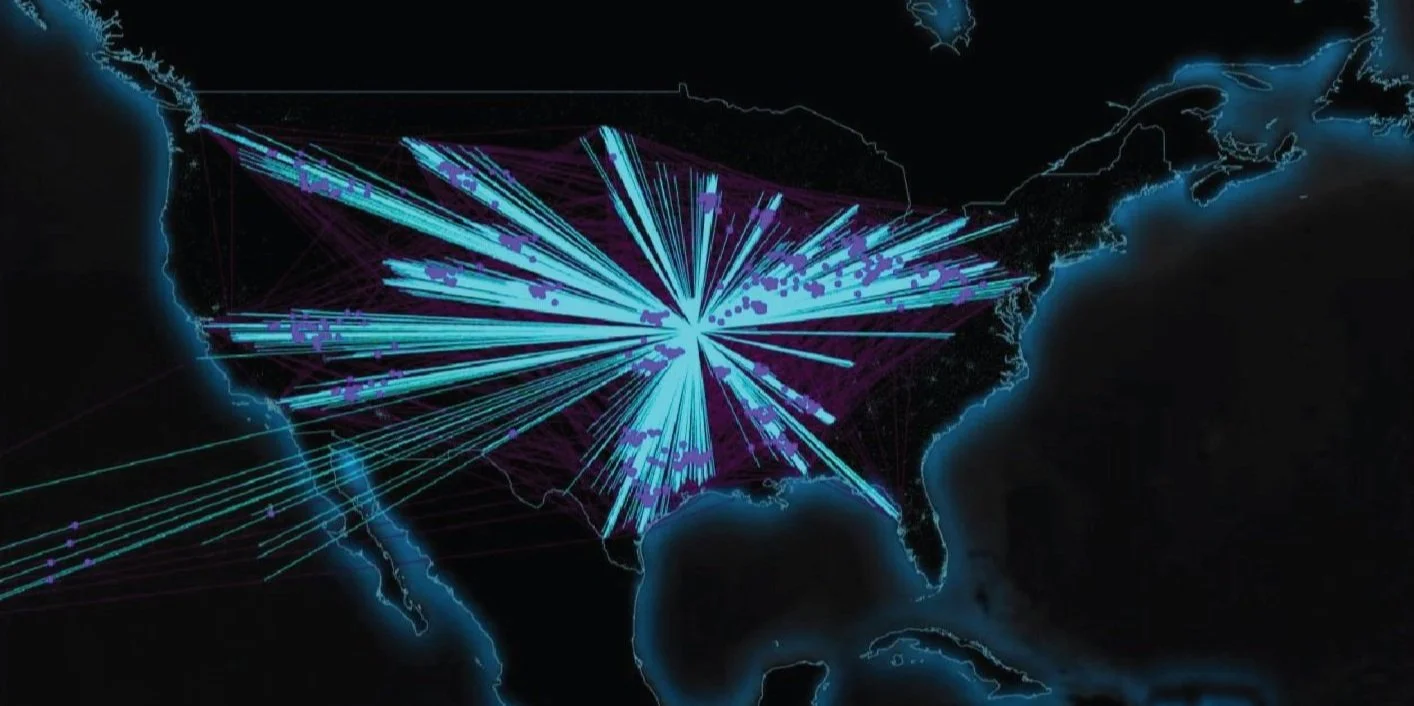
Construct freight flow vectors between origins and destination key value pairs in the imported CFS data.
Construct a vector between point m and point RC. This vector will be used as the tangent vector input when constructing the Bezier curves.
Use a bezier curve node to construct the brush arcs of the freight flows. Plug origins and destinations in to the node’s start and end parameters and use the vectors constructed in the previous step as tangent parameters for their respective points.
Examples


