Locating Infrastructure Projects with Data Mining
Objectives
This past year I started working on a variety of data mining projects with the aim of identifying geographic locations that may see significant infrastructure projects in the near future. The data mining tools developed for these projects use a combination of data from federal agencies in order to track what where federal dollars are being allocated to via contracts with private contractors and determine if those locations also match key indicators of economic expansion. Currently these tools are set up to analyze contracts from the Department of Transportation and analyze commercial aviation operational metrics from the Bureau of Transportation Statistics. By analyzing these two sources of data together we can see where federal dollars related to transportation infrastructure projects are being allocated and cross reference operational metrics to see if those projects may be related to capacity expansion efforts. With further development, many other fields of data can be integrated into this analysis.
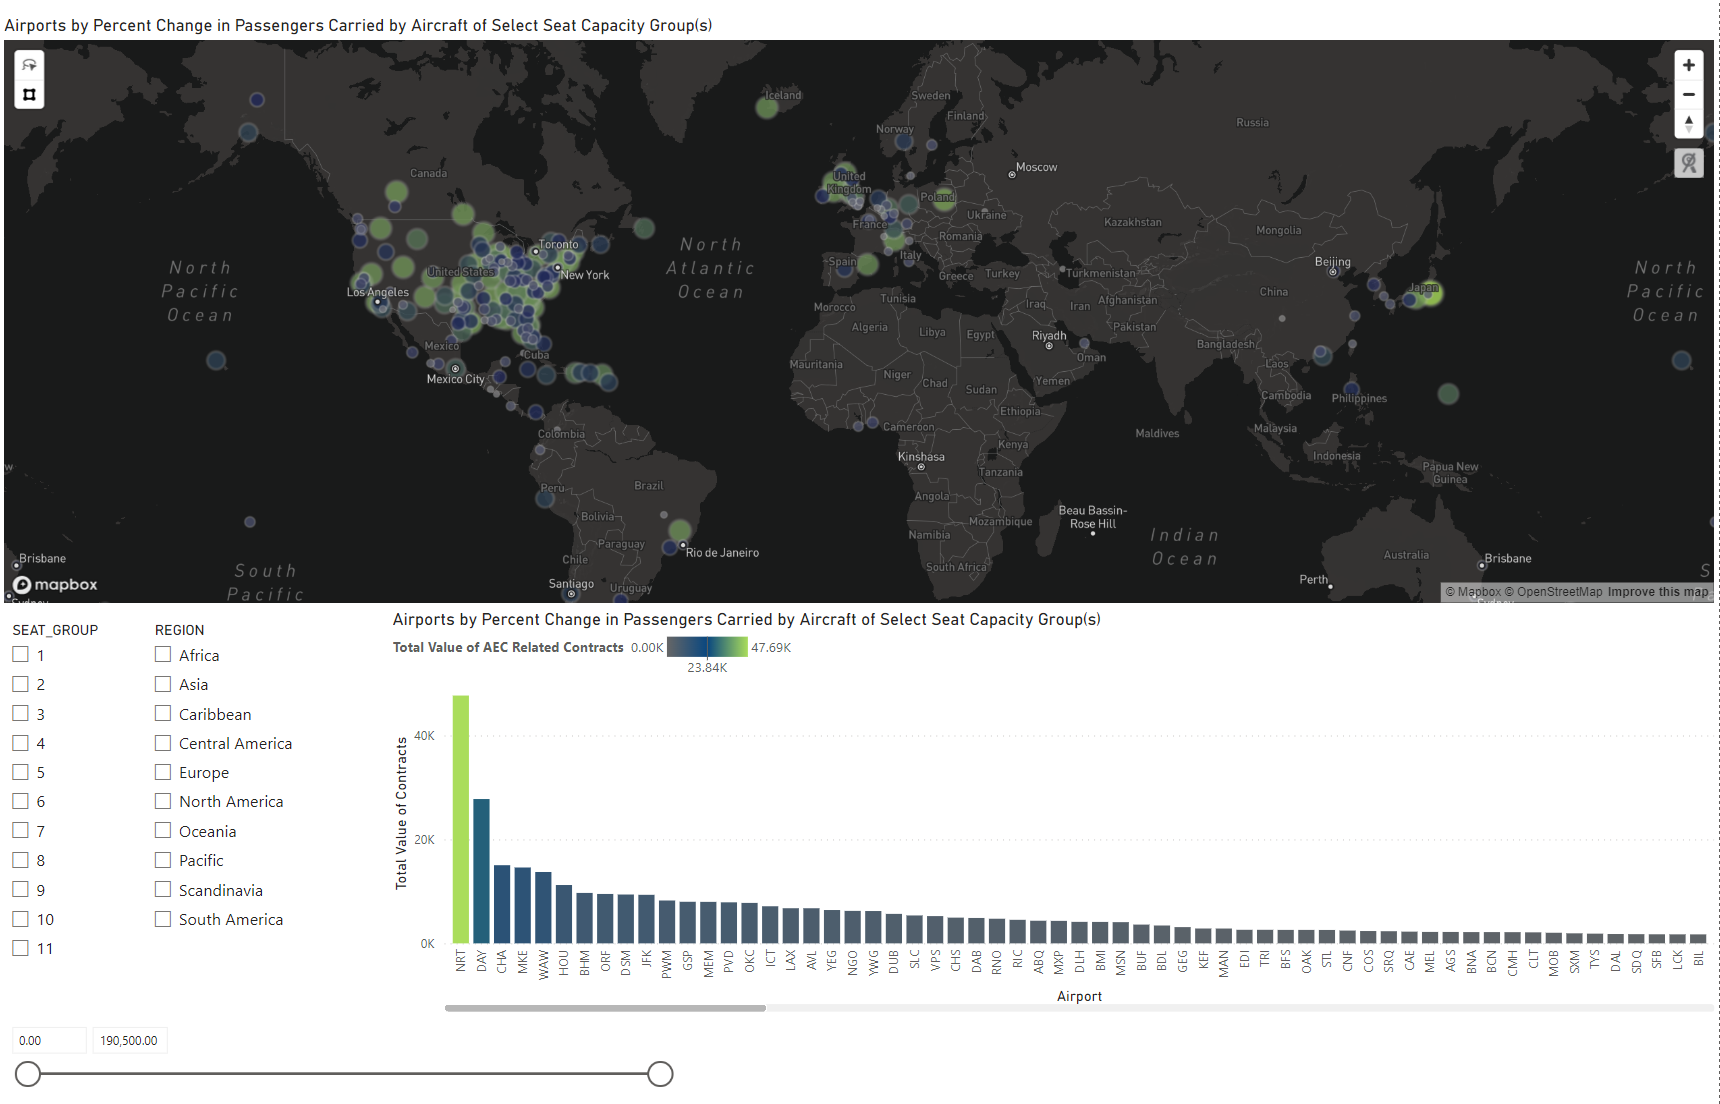
Operational metrics from the BTS contain a wide variety of metrics which can be analyzed to understand the operational trends of a given airport, region or of commercial aviation more broadly. For the purpose of this post I will be focusing specifically on seat capacity, since that metric can tell us a lot about trends in passenger throughput. The example I will go over in this post will provide a high-level overview of how seat capacity analysis and contract mining can help to identify specific locations which have seen notable increases in passenger throughput and have seen significant funding allocations for transportation infrastructure projects.
Data Sources
Aviation operational metrics were sourced from the Bureau of Transportation Statistics' T-100 Segment data products and federal contract awards for transportation projects were sourced from the Department of Transportation’s contract award allocations from USASpending.gov.
Seat capacity analysis
Seat capacity is an important metric for airlines and airports as it represents the maximum number of individuals that can be accommodated on a given flight. This metric is especially relevant when projecting the future needs of an airport since increased capacity means an airport will need to expand infrastructure to accommodate increased passenger throughput per flight. Gates and hold-rooms that were designed decades ago (as many in the U.S. are) were designed to accommodate far fewer passengers per flight than modern airlines are designed to accommodate. This means those locations may face over-crowding of passengers that may negatively impact operations and passenger experience.
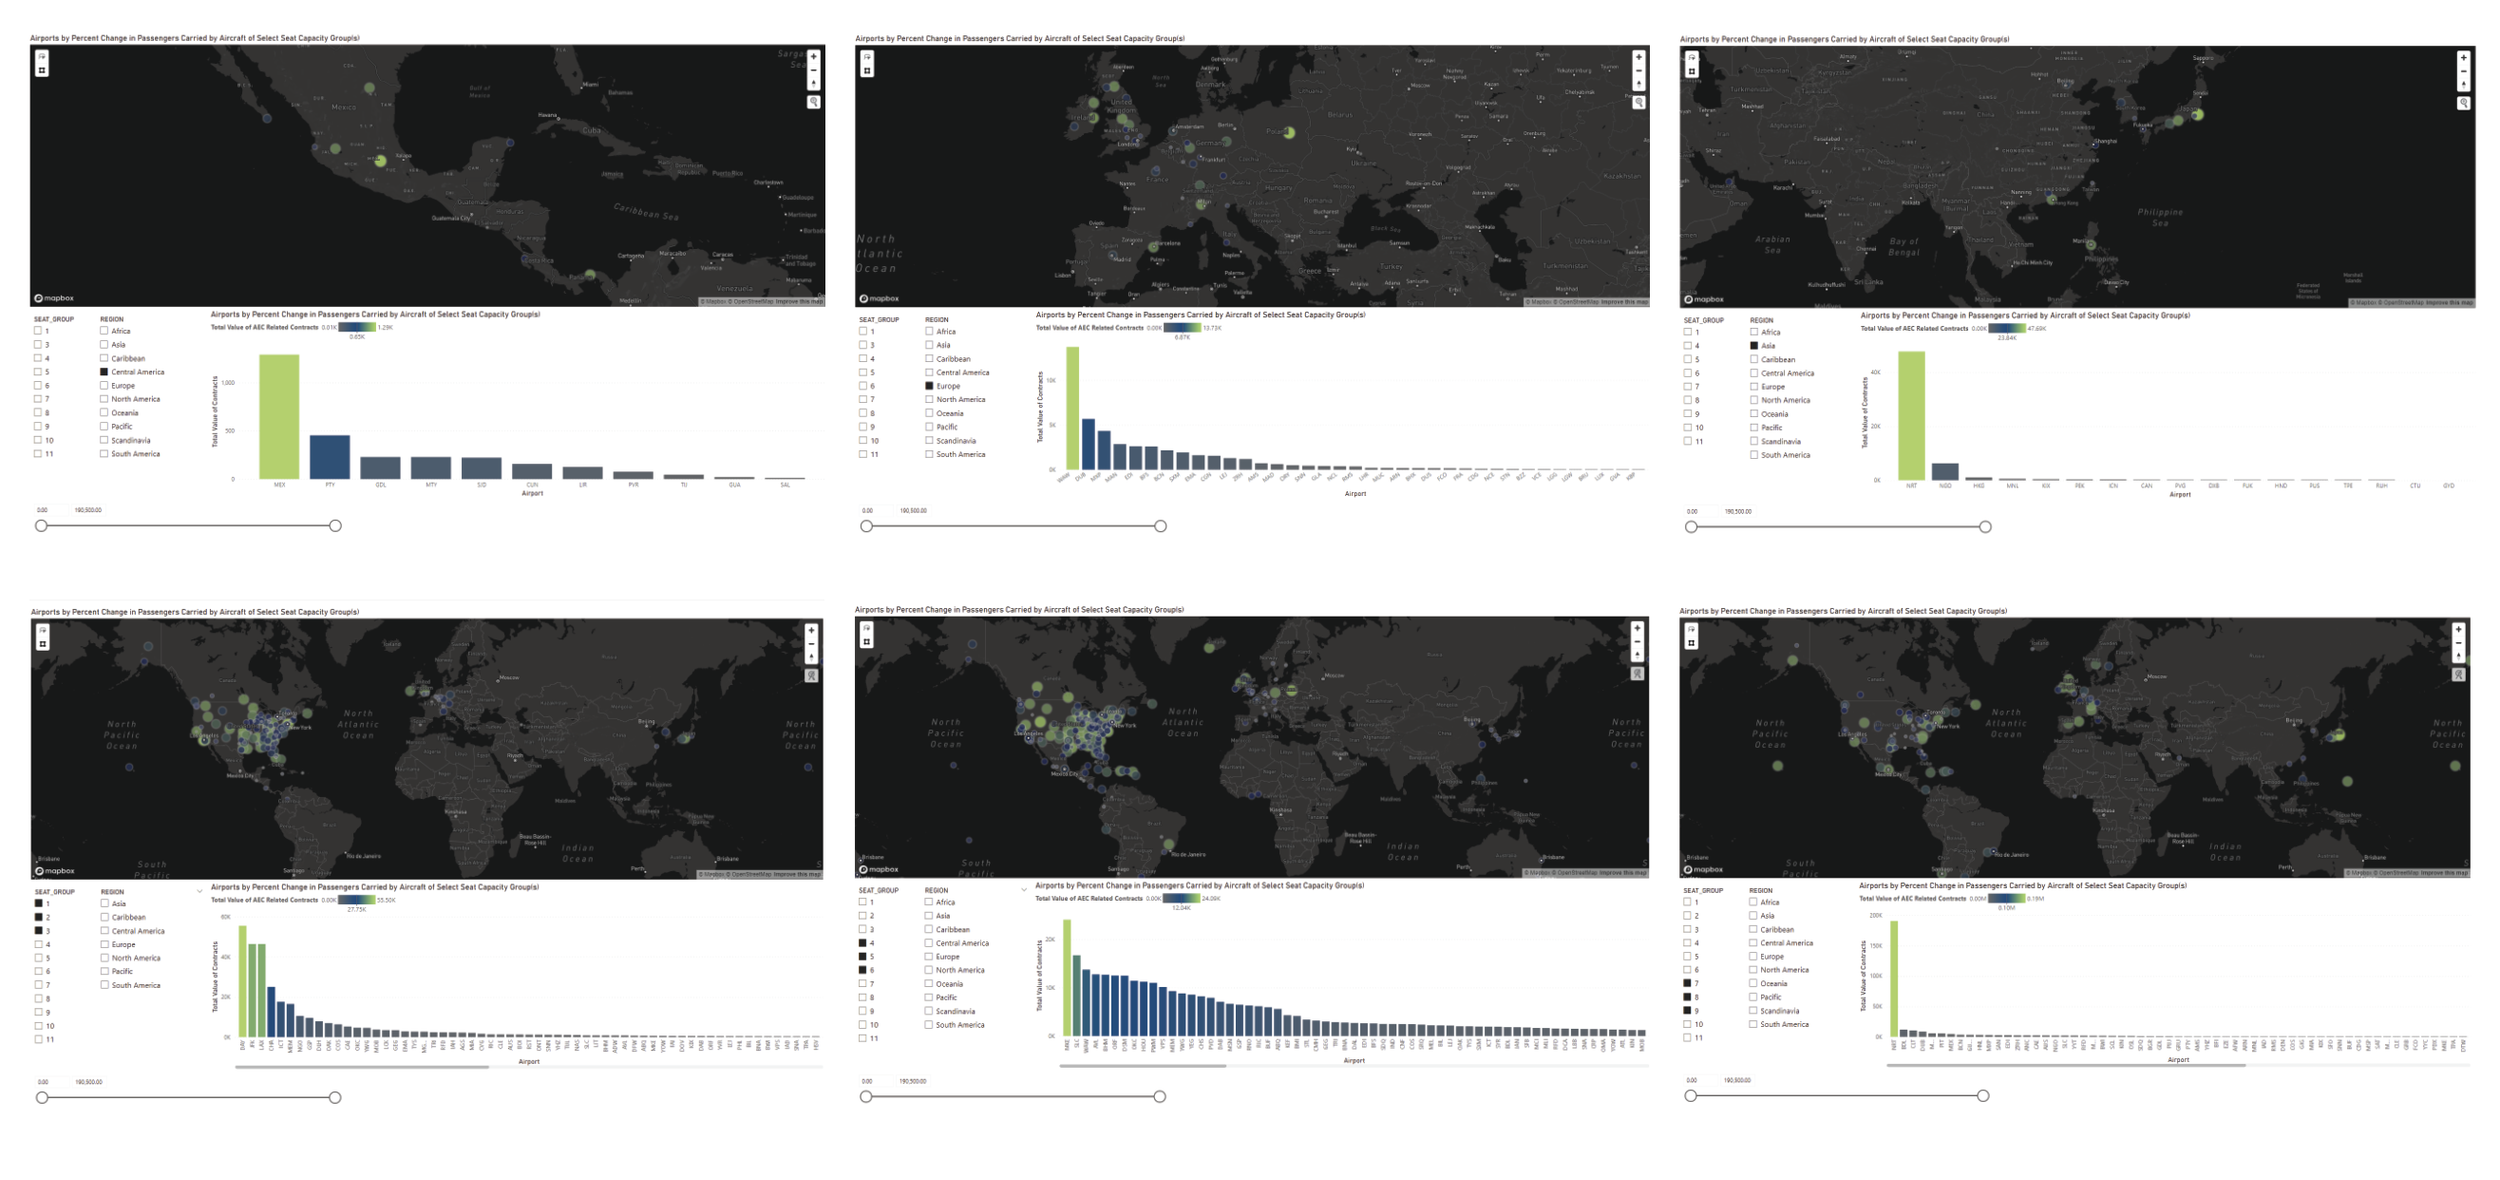
This analysis drew from the BOT's T-100 Segment data and measured the change in seat capacity at major airports between 2010 to 2022. The percent change average seat capacity was then used to filter airports with significantly high seat capacity increases. The results allowed us to identify specific airports that may be likely to need capacity expansion projects in the coming years to accommodate increased passenger throughput.
The dashboard is set up so the user can filter the results of the seat capacity analysis by region and by aircraft seat group designation.
Federal Contract Analysis:
The federal government provides access to datasets pertaining to contracts between federal agencies and private companies. The datasets can be access via USA Spending. Mining these types of datasets can provide useful insights into where federal dollars are being allocated, both in terms of geographic locations and what companies are being contracted to do work. This analysis focused specifically on contracts awarded by the Department of Transportation and looked specifically for projects that may pertain to the AEC (architecture, engineering, construction) industries. The analysis process can be broken into the following steps.
NAICS Filtering
The NAICS (North American Industry Classification System) code associated with each award was used to filter the dataset to awards that pertaining to AEC projects. The code written for this analysis references files that contain NAICS codes, description and other classification information.
Geographic Aggregation
Once filtered, the analysis tools geographically aggregates projects with their nearest metropolitan area. The zip code associated with the project location is formatted and referenced against a custom geo-crosswalk file which contains the zip codes associated with metro-areas and the coordinates of the interpolated center of the zip code tabulation area. By aggregating the data geographically, we can identify specific metro-areas and regions in the country that have lot of high value projects ongoing or planned.
Recipient Aggregation
This step aggregates awards based on their recipient to provide a summary of what companies have been awarded work. This process maintains a connection between the recipient and the individual projects and their locations so the dashboard user can select a company and see where (geographically) they have been awarded projects.
Above, we can see the top companies who received DOT contracts in the analysis period and where those projects are located. We can see the there are large projects planned or ongoing on the North Atlantic seaboard, Florida, Georgia, Texas, Oklahoma, Minnesota, California, Oregon and some notable work in Alaska and Hawaii. With the interactive dashboard, the user can further investigate these projects through the map or bar graph.
The diagram here shows the top companies within the filtered NAICS categories by total award value, organized by sector. Here we can see the major sectors the DOT is contracting are IT services and consulting, engineering services, construction, business consulting and aviation/aerospace component manufacturing.
The combination of identifying airports that have seen significant seat capacity increases and metropolitan areas that have significant federal funding for transportation related construction projects can help pinpoint specific locations that may see major transportation capacity expansion projects in the near future. This analysis also incorporated data such as construction cost indexes, population growth, and migration data, but for this post we will just keep it to airport capacity and DOT contracts. I’m revisiting the data mining tools made for this analysis with the intent of building them into a comprehensive industry data mining tool-kit. I' plan to post progress on that development effort soon.


