Chemical Descriptor Analysis
This research, data analysis and visualization project stemmed from a work related research project I was a part of in 2020-2021 which aimed to understand the impact of scent on an individuals perception of architectural space. As a part of that effort, I developed text mining and visualization tools to help understand the connection between the language used to describe scent and the chemical components of a particular scent.
Data Collection
The main data source for this project was PubChem; a public database containing information of chemicals, compounds and the materials. I started by collecting data on chemicals associated with a variety of scents our team was interested in researching and compiled the data into a repository. The data contained detailed information on each chemical, including the atomic structure, color and odor descriptors.
Pubchem : https://pubchem.ncbi.nlm.nih.gov/
Analysis
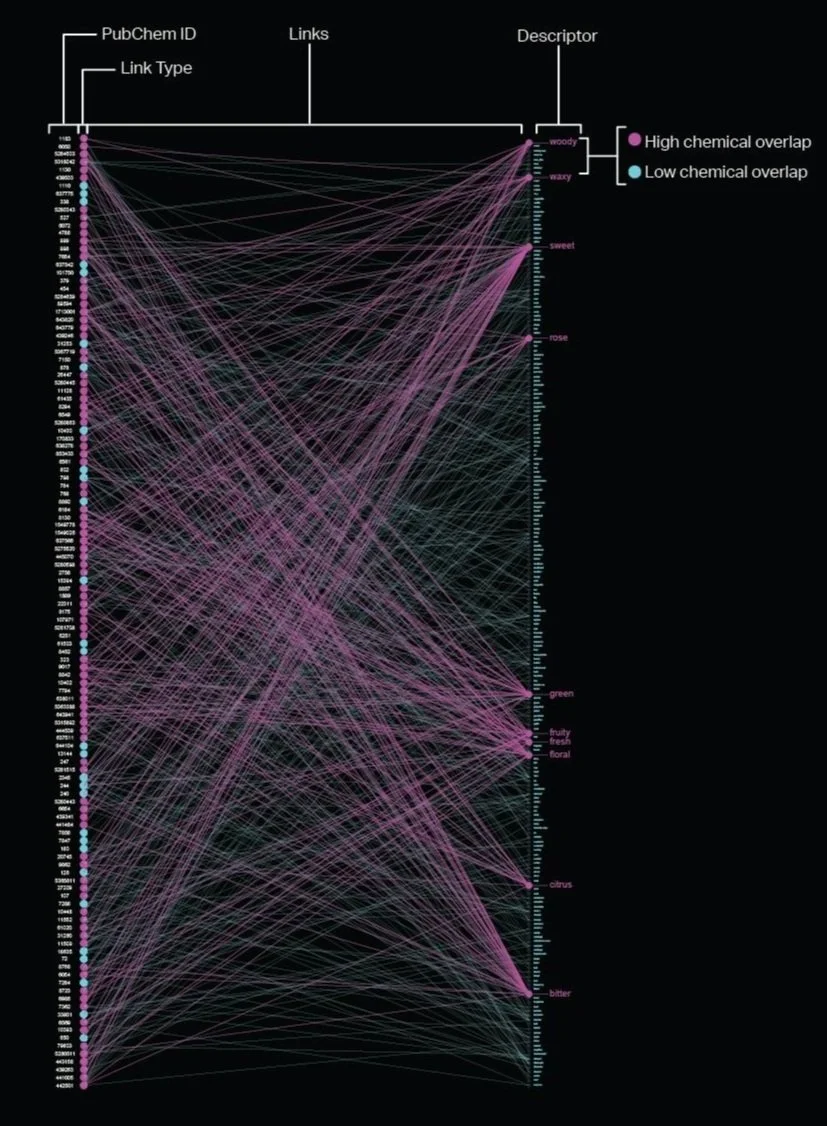
Each scent was associated with anywhere from a few dozen to hundreds of chemicals, each of which contained lists of terms that described the color and odor of the chemical. This brush visualization shows the connections between each unique chemical associated with a particular scent (left) and maps a link to the list of unique descriptive terms (right).
The large number of connections between chemicals and descriptor meant we needed to reduce the data down to its core components in order to identify what chemicals were associated with the dominant descriptive terms.
Various text mining methods were employed to filter out descriptive terms with less relevance and to identify descriptive terms and with greater relevance as well as the chemicals the terms were associated with. Prior to conducting the analysis, terms were cleaned by running them through a stemming process to allow for a more accurate term frequency analysis. After the descriptive text was cleaned/stemmed, term frequency - inverse document frequency (TFIDF) was used to weigh terms based on the number of chemicals the term was associated with. Each scent was treated like a document, and so descriptive terms that were associated with several chemicals in several scents were given a lower weight, since they were less unique and therefore less likely to be a defining characteristic of a scent. Descriptors that appeared several times in only a few scents, were given higher weights. Descriptors with higher weights are colored magenta, and descriptors with lower weights are colored cyan.
This project was done back when I was still new to programming and data science, so if I were to redo this project today, I would adapt my approach to this analysis and most likely use principal component analysis (PCA) or similar methods to identify the dominant components of each scent.
Visualization
The analysis was run on several scents and helped us quantify and visualize the differences between scents from an experiential perspective. This exercise was also helpful in developing ideas for how we could use descriptive language pertaining to odor and color, to quantify the experiential quantities of scent.
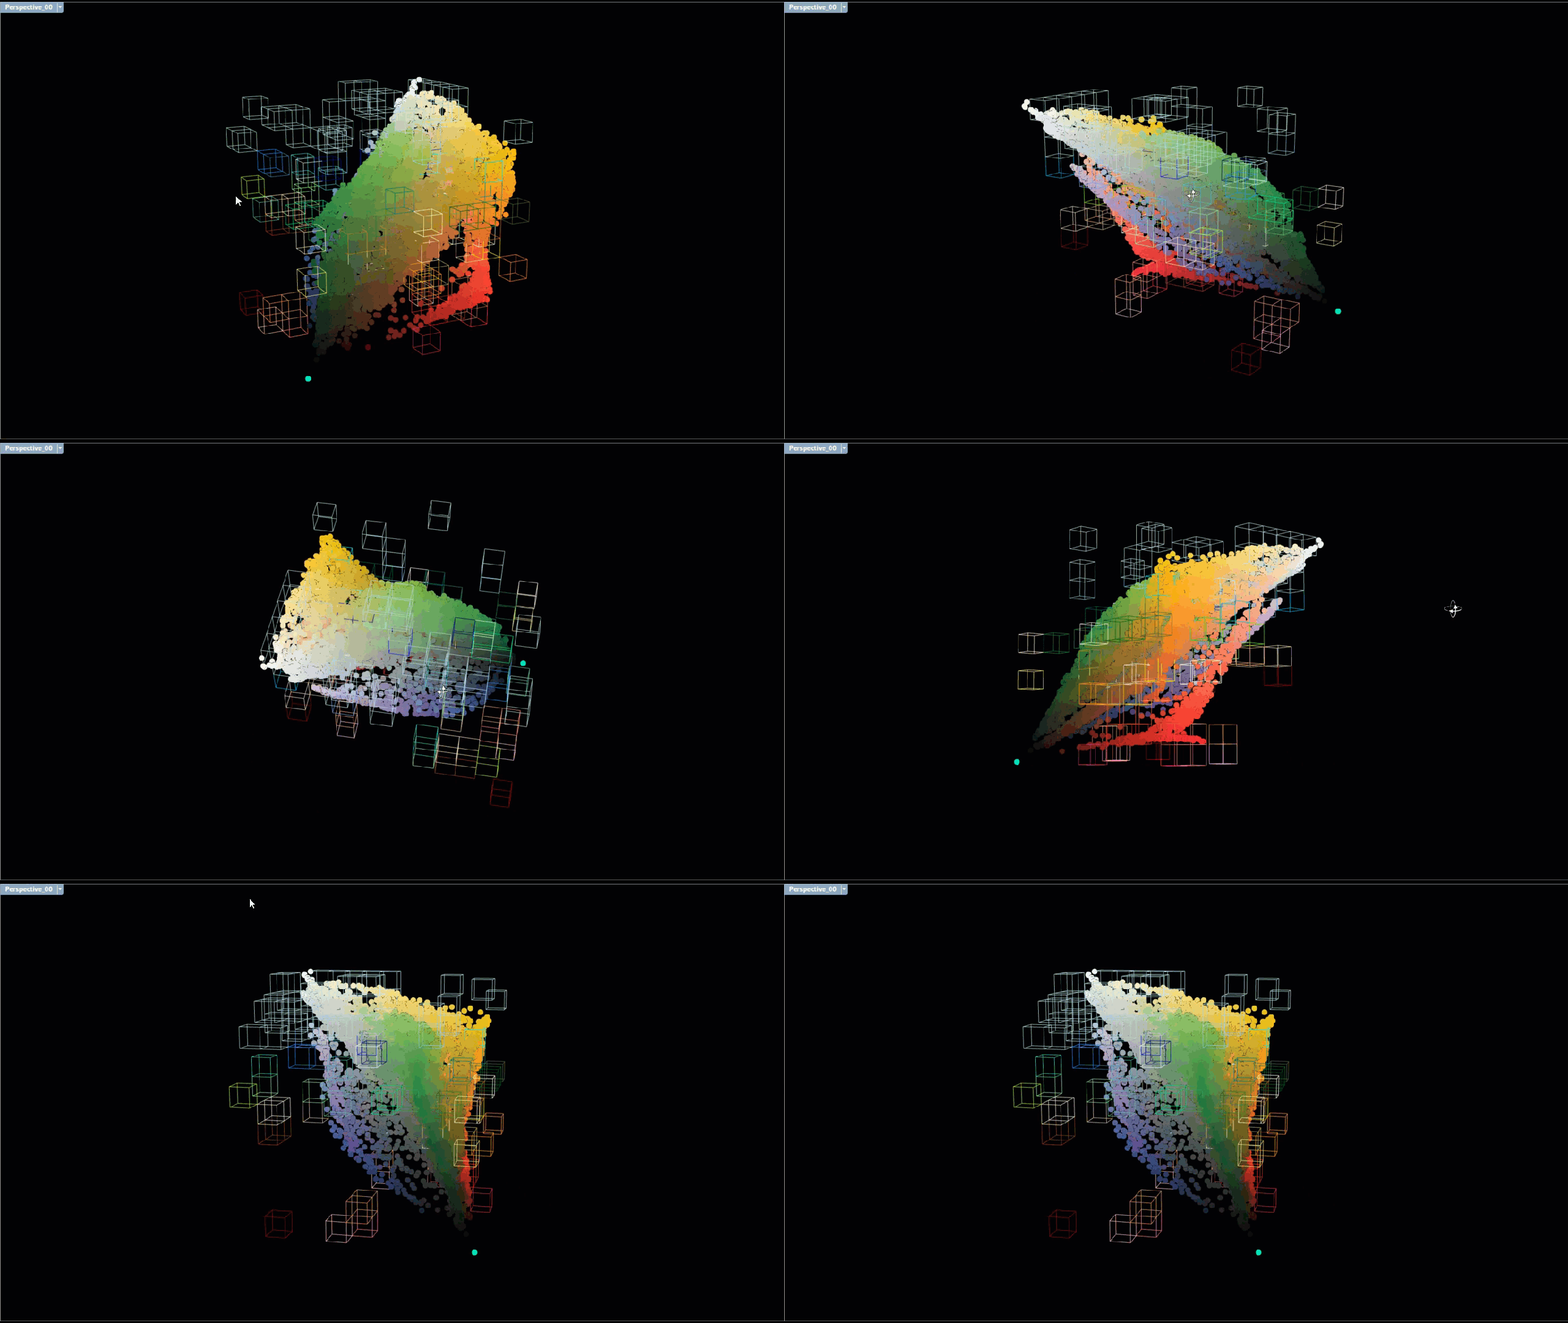
Language and Color
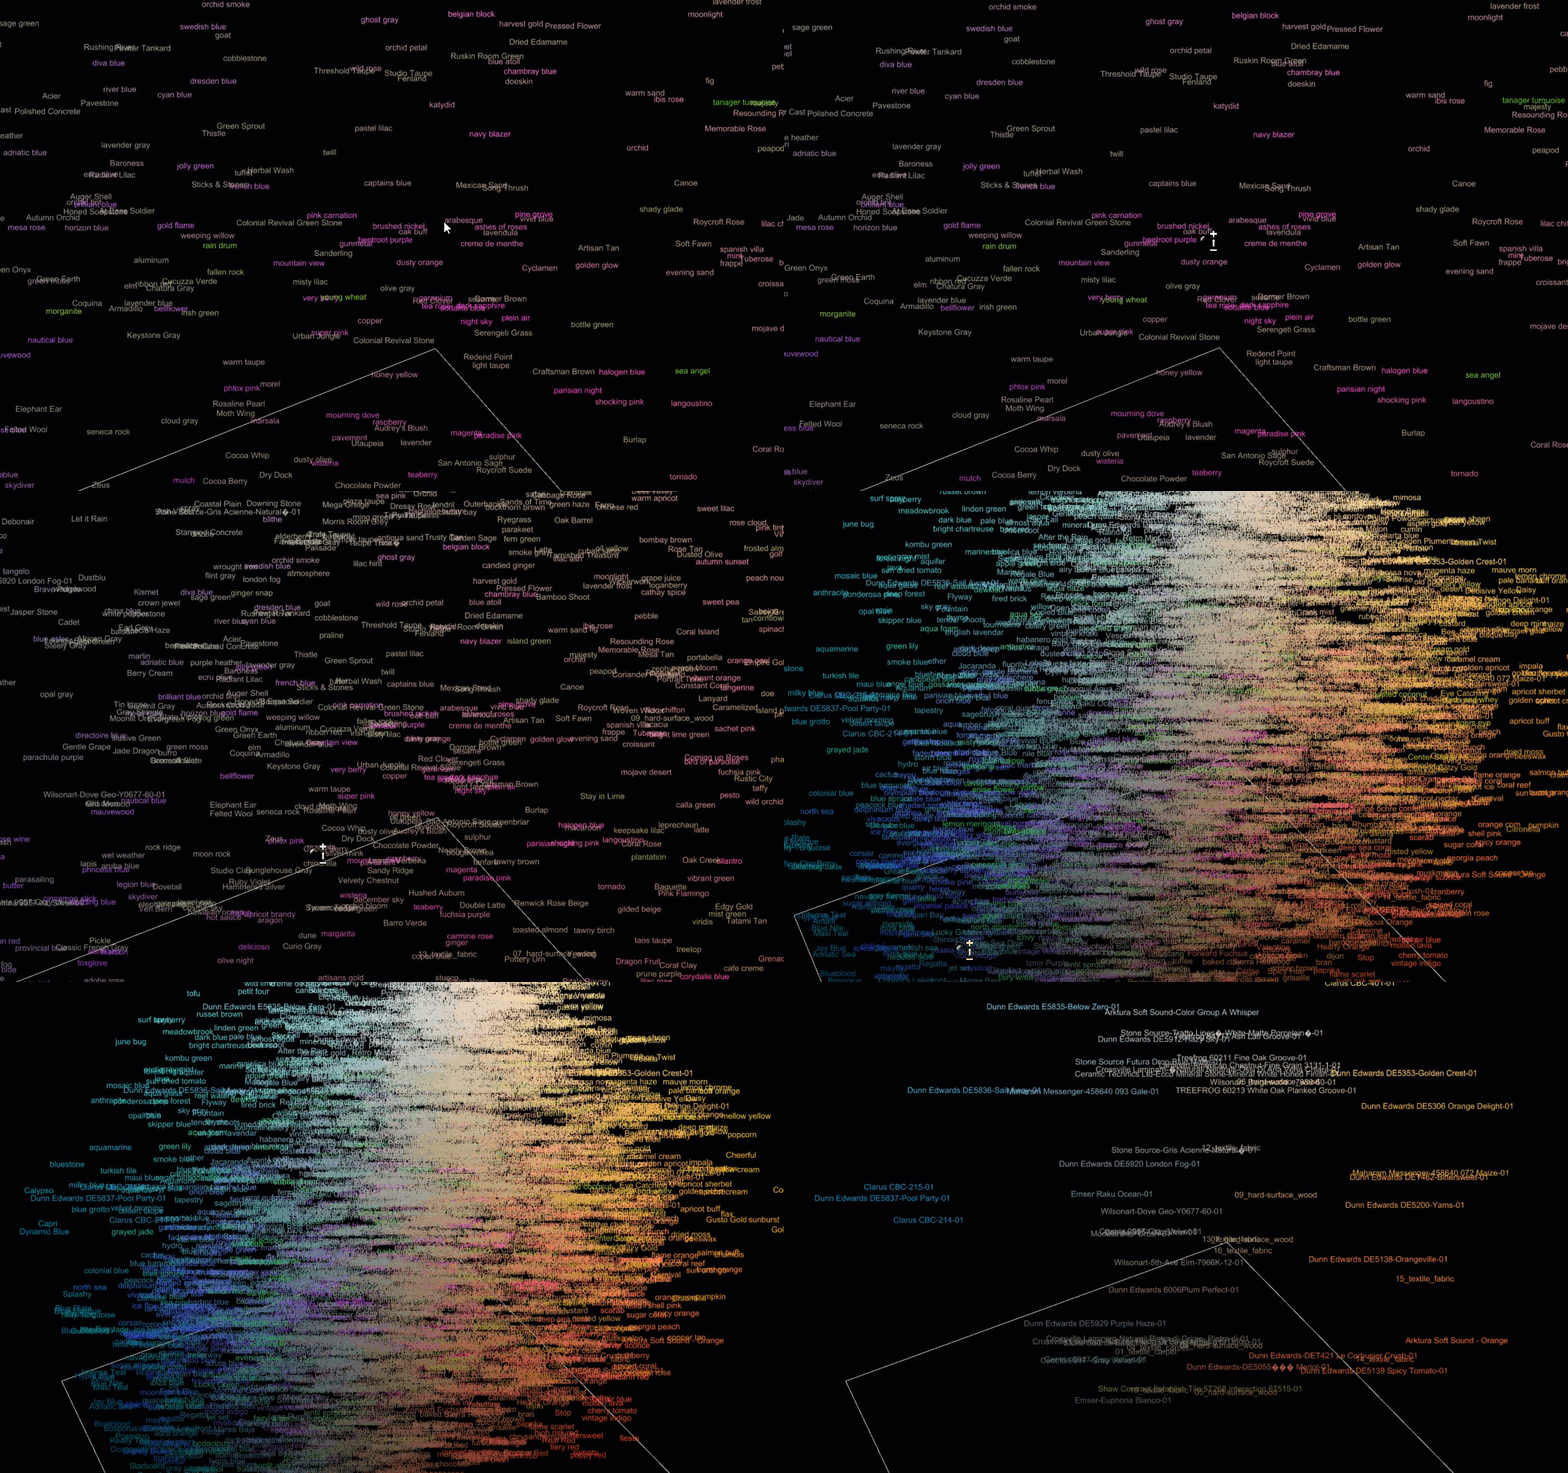
As noted above, this exercise helped to further ideas in how we could use descriptive language to understand the connection between odor, color and experiential metrics. This prompted an effort to try to develop computational tools that would map us to a particular scent based on color inputs. A dataset of Pantone colors was compiled, containing the RGB, Hex code and name of each color. The colors were clustered into groups based on their similarity and the names of colors in each group were pooled together and compared to the scent data.


