Demographics and Housing Spatial Patterns
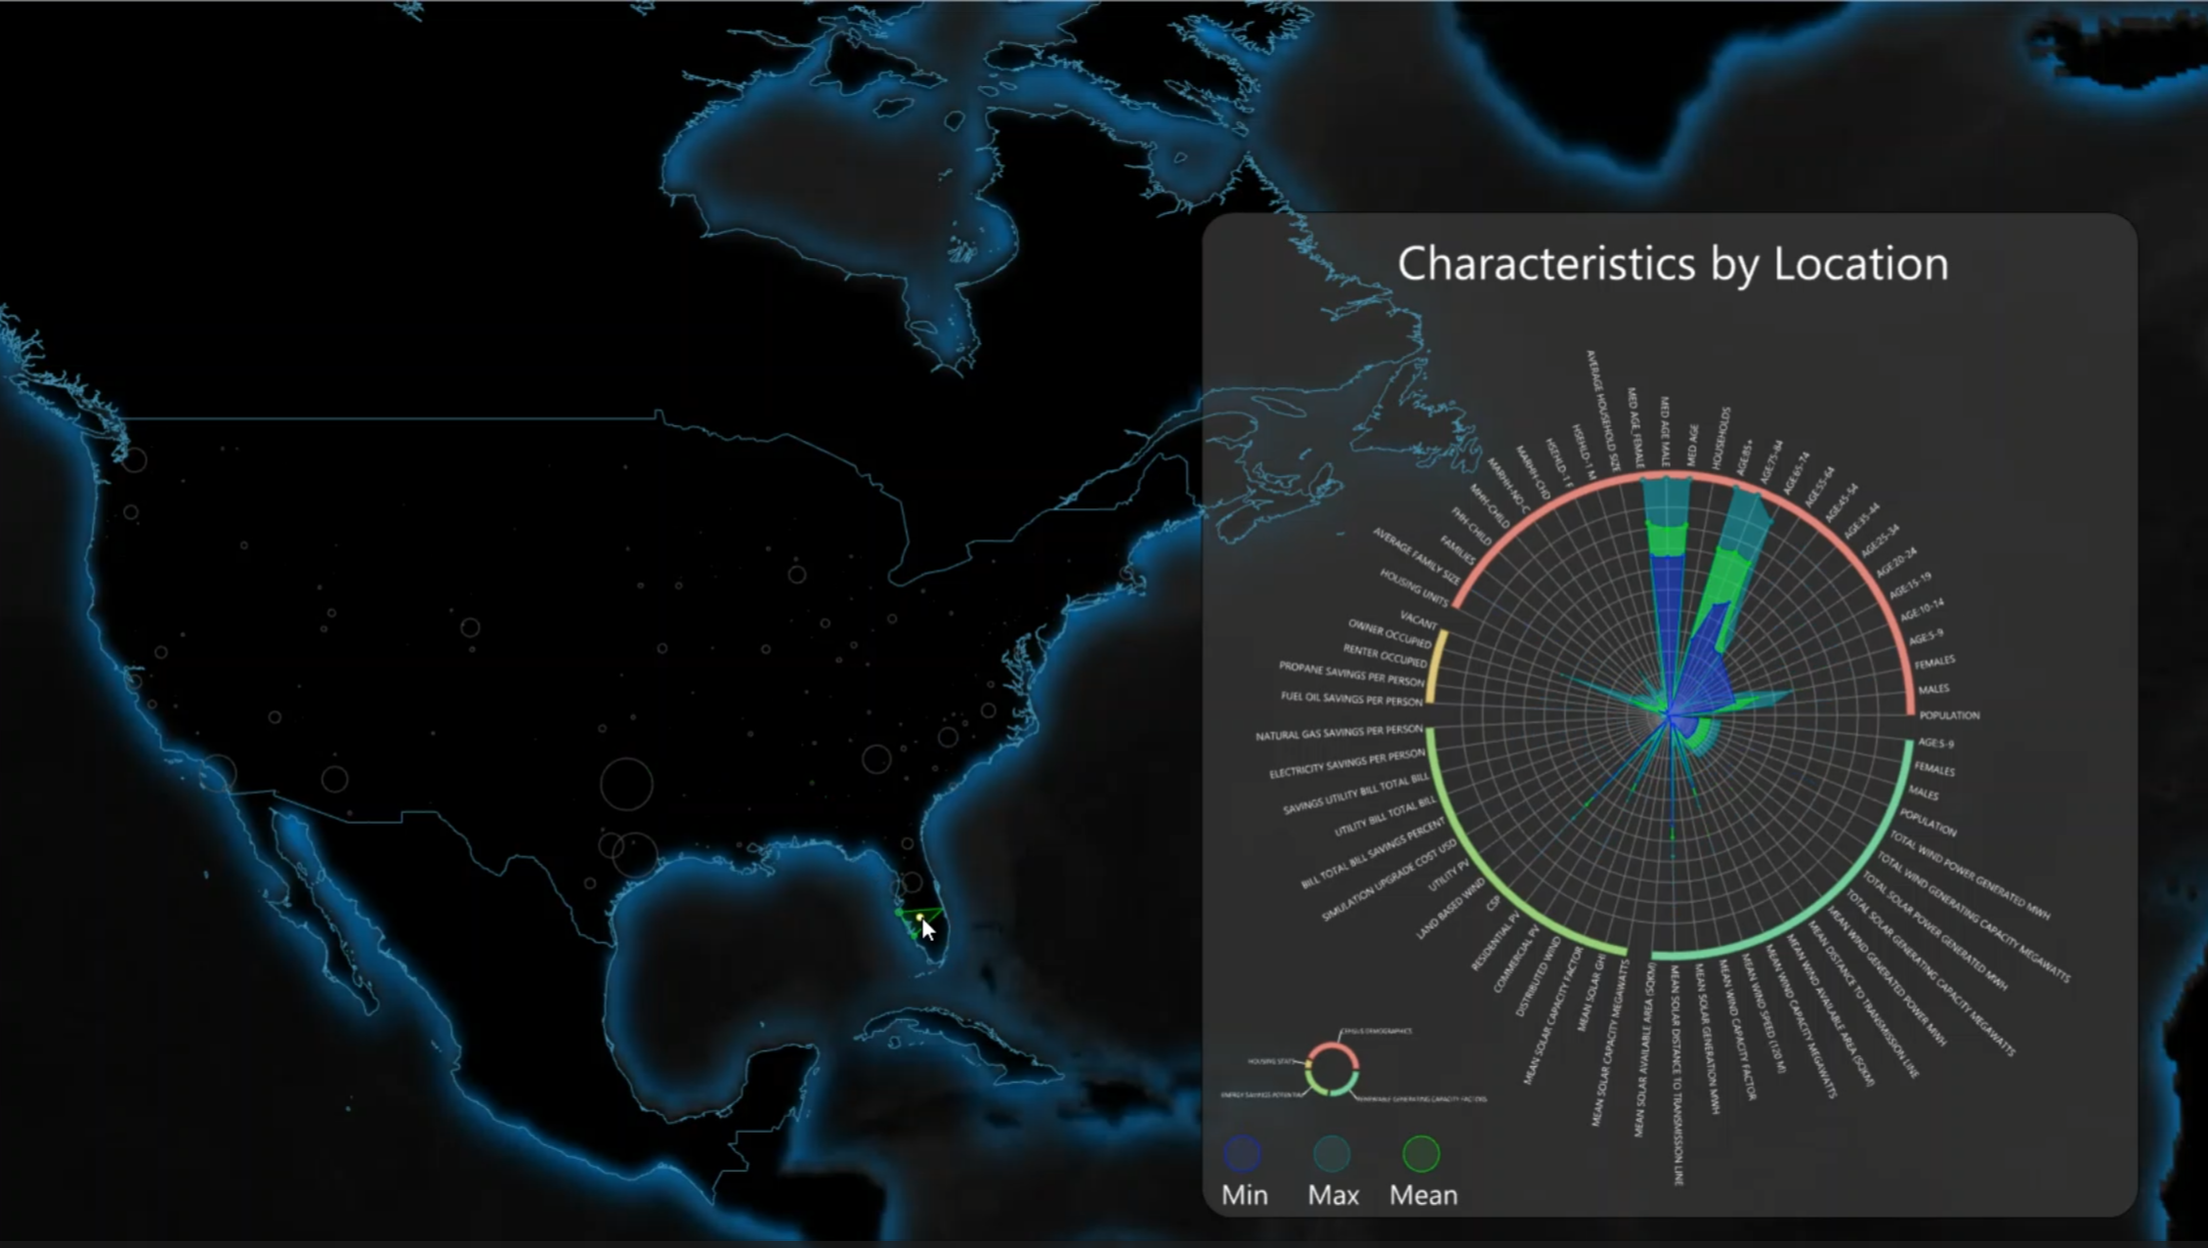
This prototype analytical platform was developed to support a housing and at-home technology pursuit by demonstrating advanced spatial analytics and visualization capabilities. Built with Python, Rhino 3D, and Grasshopper, the workflow harmonized demographic, housing, energy, and permit datasets, including sources from the United States Census Bureau ACS and United States Department of Energy SLOPE platform, into a unified geospatial system aligned to ZIP codes. Users could interactively draw custom study areas across the United States, triggering real-time aggregation and visualization of localized metrics through spatial overlays and radar chart analytics. Developed as a rapid prototype, the tool demonstrated end-to-end capabilities in data engineering, geographic harmonization, interactive visualization, and computational design workflows.
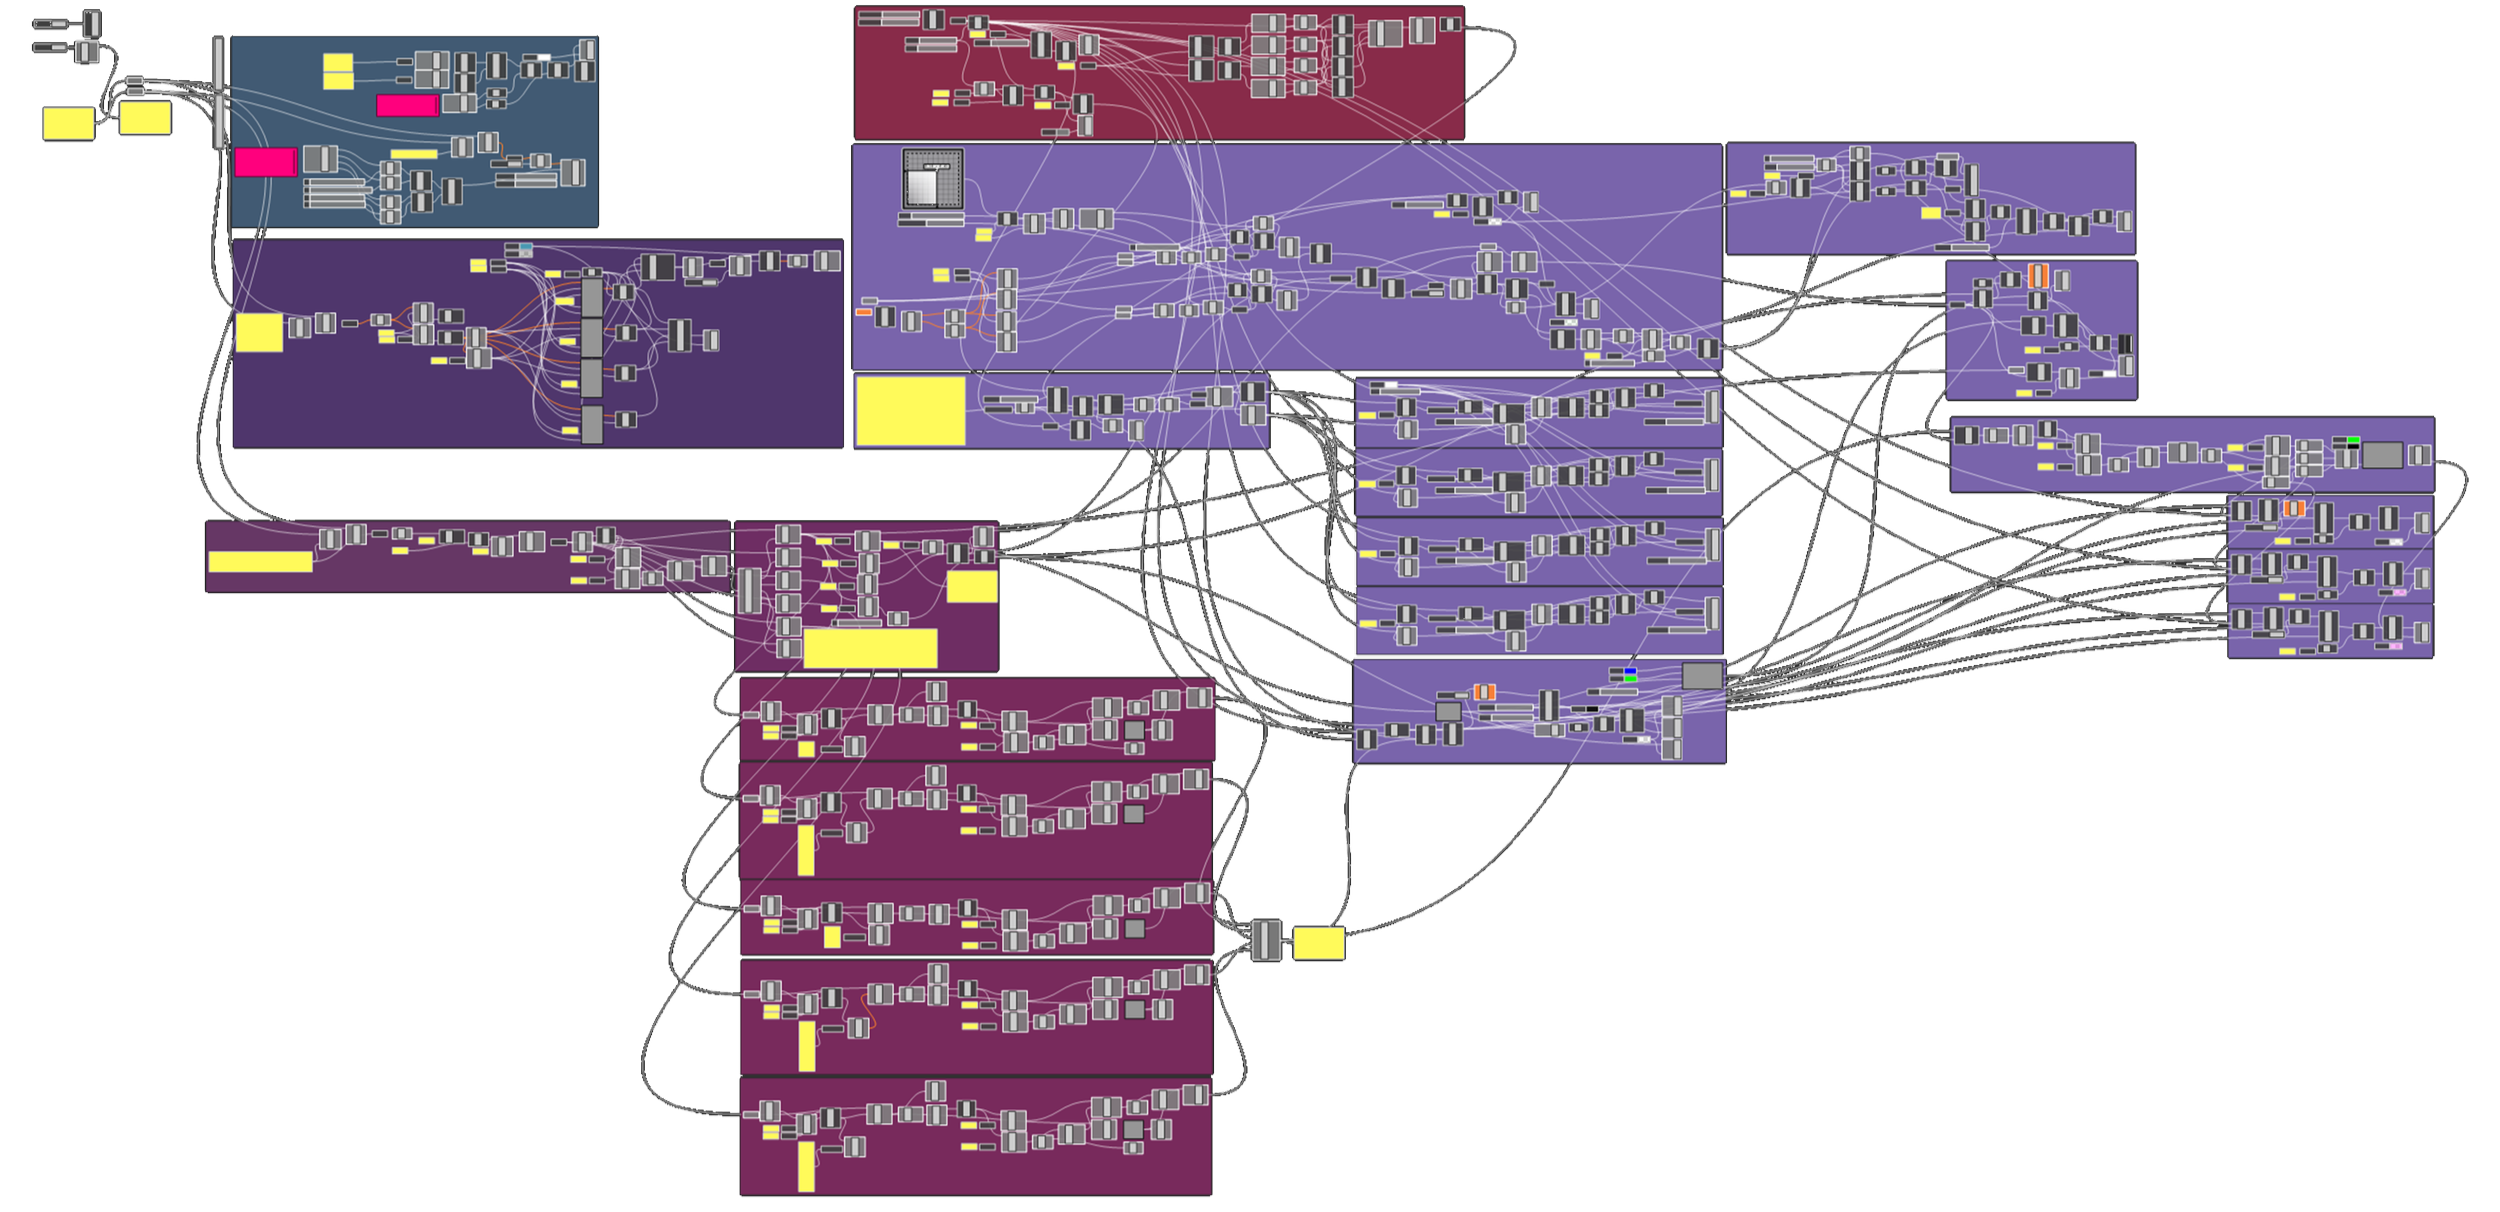
Prototype Rhino-Based UI
Within Grasshopper and Rhino 3D, geographic datasets were translated into spatial point objects, allowing demographic, housing, economic, and energy-related attributes to be directly bound to model geometry. Users could define an area of interest either by drawing custom polygons or interactively moving a bounding region across the map. The system evaluated which geospatial points fell within the selected region, extracted the associated attribute data, and dynamically aggregated and normalized the results for visualization.
The radar chart itself was developed as a fully parametric geometric system within Grasshopper. A base circle was subdivided and shattered into evenly distributed directional axes, with each axis representing a measured parameter such as demographics, housing, or economics. Normalized summary statistics controlled point locations along these axes through curve evaluation operations, and the resulting points were connected to generate responsive polygonal forms. This created an interactive analytical visualization where shifts in geographic selection immediately transformed the radar geometry to reflect changing spatial conditions.